GST – One Nation, One Tax

Touted as the biggest tax reform since Independence, the GST bill has finally been cleared by both houses of parliament after several months of struggle. A question then arises – what is all the hype about?

For a moment, imagine that you came up with an idea to manufacture and sell a product P. For procuring the raw materials, you would be asked to pay the price that includes taxes (Excise Duty). Also, as the product P is manufactured, there is value addition by the manufacturer, hence the Value Added Tax (VAT) will be charged. As the product P transfers from manufacturer to the wholesaler to the retailer, each entity adds the margin and add the corresponding taxes (sales tax, entry tax) to the price of the product P. At each stage, there is no way to offset the new tax with an already paid tax, for example, the initial VAT on the product P was charged on the price that already included the Excise Duty; there is no way to exclude the Excise duty already paid from the VAT computation. Thus, the consumers not only end up paying multiple taxes on the same product but also pay tax on tax! The problems are exacerbated by the huge tax compliance cost due to stringent norms and difficult procedures.

In summary, the current system suffers from various issues such as multiple indirect taxes with an assortment of taxable events, multilayered and varied taxation rates throughout the country, multiple agencies collecting taxes, and last but not the least – cascading effect of taxes with inability to claim credit under one tax to set off liability against another.

So how will the GST help and why is it termed as a game changing reform for not only the Indian taxation regime but also the economy as a whole?

What is GST?

GST is a destination based, single indirect tax for the whole nation which will make India one unified market. GST will follow the Destination Principle meaning that the tax will go the state in which the final consumption of the goods or services will take place.

It is a comprehensive tax covering all stages including manufacturing, sales and consumption. Many indirect taxes levied by the center & state will be subsumed (excise duty, service tax, value-added tax) thereby reducing the distortionary effects. Credits of input taxes paid at each stage, from manufacturer to the retailer/distributor will be available in the subsequent stage of value addition, which makes GST essentially a tax only on value addition at each stage.

Three categories of GST will be introduced- Central GST, Integrated GST and State GST

The final consumer will bear only the GST charged by the last dealer in the supply chain, with set-off benefits at all the previous stages. This would eliminate cascading and distortionary effects of the current multitude of indirect taxes, reducing the cost of production and giving businesses an opportunity to evaluate pricing policies.

Impact on Economy

The GST regime should result in production efficiencies that could raise global competitiveness, improve profitability and increase GDP. It will generate a third party paper trail and prevent tax evasion or black money circulation. Doing business in the country will be tax neutral irrespective of the place of doing business.  GST would mitigate huge compliance cost incurred by the companies on complying with various different indirect tax laws, administrative cost incurred by the Government, capture value addition and widen the tax base; it would generate a third party paper trail and prevent tax evasion or black money circulation; and it would boost exports by making them zero rated.

Exports

Currently, Indian manufacturing companies have modified their supply chains into complex transaction structures to adapt to the multitude of indirect taxes which make the exports uncompetitive. Foreign companies are sceptical of committing large capital investment in India. They have turned to China –More attractive SEZs and export zones. GST is expected to reduce cost of production, thereby boosting exports (3-6% gain expected). GST will create a seamless market and broaden the tax base. (Boost of 0.9-1.7% to GDP)

FDI

India continues to have 7%+ growth rate, making it an attractive destination for global capital. However, a confusing and burdensome tax structure has posed several challenges.  Introduction of GST will help in rationalisation of the tax structure & transform India into a truly integrated single economy. A certain and uniform tax regime will boost foreign investor confidence reinforcing the fact that India is committed to structural reforms. This reform is expected to bring in a manufacturing revolution, ushering ‘Make in India’ and creating millions of job opportunities.

Inflation

In the short term, GST is expected to create inflationary pressures (up to 60 bps).

However, price benefits due to increased efficiencies in production & distribution, avoidance of double taxation & proposed revenue neutrality are expected to bring down inflation in the long term.

GST1

Roadmap of GST

The path to GST starts more than 15 years ago. In 2000, the Vajpayee Government started discussion on GST by setting up an empowered committee, headed by Asim Dasgupta, (Finance Minister, Government of West Bengal). The committee was given the task of designing the GST model and overseeing the IT back-end preparedness for its rollout.

Later in 2006, the then Union Finance Minister P. Chidambaram moved towards GST in his Budget, and proposed to introduce it by 1st April, 2010. However, the Empowered Committee of State Finance Ministers (EC) released its First Discussion Paper (FDP) on the GST in November, 2009. Multiple debates have taken place regarding the bill pertaining to the proposed tax rate, the agreement from the states especially the manufacturing states (the states losing the revenue), and the inclusion of petroleum products and liquor under the purview of GST.

Inability to reach a consensus with respect to these issues compounded by the rivalry at the national level politics delayed the implementation bill significantly until Aug 3, 2016. The bill was finally passed in both the houses of parliament through extensive negotiations from the Modi Government with all stakeholders. The bill will have to be ratified by minimum of 15 states in their respective assemblies before going to President for approval. The GST Network (GSTN), the IT backbone will be launched and the states will be required to frame their GST legislations so that the bill comes into effect starting Apr 1, 2017.

Archana Maganti, Maithili  Kalelkar, Madhur Bajpai & Shreya Aggarwal

Disclaimer – All the views expressed are opinions of Networth – IIMB Finance Club – members. Networth declines any responsibility for eventual losses you may incur implementing all or part of the ideas contained in this website.

Managing Market Expectations in Monetary Policy

5

The markets expected Developed Economy policy makers (Japan and UK in this case) to be dovish and they were. In Japan, while the Bank of Japan (BoJ) left policy rates unchanged, there was a fiscal stimulus package worth ¥28.1 trillion (to help give loans to SMEs that may suffer from Brexit); whereas in the UK, the Bank of England (BoE) cut the policy rate and proclaimed to purchase corporate bonds.

An important question here is whether they met market expectations and how did the policy announcements impact different asset classes?

 BoJ and BoE Market Expectations

Before their respective meetings, the market participants had the following expectations:

Expectatitons Image

BoJ’s Policy Announcement

Shinzo Abe propounded the three arrows of Abenomics – fiscal stimulus, monetary stimulus and structural reforms – to revive the Japanese economy from the two-decades of recession. The initial hype resulted in a positive reaction from the markets (currency depreciation and rise in equity prices). Although the inflation target of 2% was not achieved, the modest inflation was an improvement compared to Japan’s deflationary past. However, Abenomics failed to live up to the initial hype. (Click here to know more)

In April 2014, a consumption tax increase led to fiscal tightening (deviation from the stated arrows of Abenomics). This adversely impacted household spending and private investments. The modest recovery soon degraded into another round of economic recession. (Click here to read more about Deflation in Japan)

BoJ announced the following steps in the meeting to address the recession:

  • No rate cut & maintained its Quantitative Easing of ¥80 trillion.
  • Increased the scale of a program to buy exchange-traded funds (ETFs) to ¥6 trillion a year from ¥3.3 trillion. (BoJ Policy Statement).

 BoE’s Policy Announcement

The uncertain implications of Brexit was the major cause for status quo in the previous meeting of the BoE. However, the significant policy easing in the latest meeting clearly indicates that the BoE wanted more clarity on Brexit’s economic implications before committing to a major policy announcement. (Click here to read more about implication of Brexit on UK)

 The Monetary Policy Committee (MPC) decided to take the following steps to provide additional support after the Brexit poll and to reach its target inflation of 2%.

  • Cut the bank rate by 25 basis points to 0.25% – 322 Year low!!
  • Introduced Term Funding Scheme (TFS) in order to pass-over the lower rates to the customers.
  • Purchase of £10 billion of the UK corporate bonds over a period of 18 months and expansion of sovereign quantitative easing by £60 billion (buying UK Government Bonds over a period of 6 months) (Click Here to know more about BOE measures)

Impact on Markets2

3

Immediately after the announcement:

  • Currency – Yen appreciated by 1% whereas the pound crashed by 1.6 %. It was the biggest fall of pound since Brexit Referendum.
  • Bond Yields – 10-year JGB Yields rose to -0.2% from -0.3% whereas 10-year UK bond yields fell to a record low of 0.639%.
  • Stock Index – The Nikkei Average tumbled by 2% as BoJ’s policy statement fell short of expectations whereas the UK FTSE climbed by 1.6% led by financial shares.

Opinion on BoJ’s action – Expectations not met on monetary policy front

In its policy statement, the BoJ mentioned that it eased monetary policy to cope with growing uncertainties in overseas economies and a rise in the global financial market volatility owing to Brexit vote and slowdown in EMs. The main objective of the actions was to help prevent these uncertainties from leading to loss in investor and business confidence.

However, contrary to market expectations, the BoJ did not cut the policy rate. The probable reason is that the BoJ wanted to get some more time to build consensus especially as banks and other financial firms have opposed BoJ’s JGB purchases and negative interest rate policy. In fact, there wasn’t any specific mention about inflation in its Monetary Policy Report and its downside risks. Given the government actions, it seems that government believes that monetary policy has become less of an effective tool to boost GDP and induce spending.The announcement of fiscal stimulus suggests a move towards the original Abenomics principles to kick start the Japanese economy.

Opinion on BoE’s action – Exceeded expectations

Given that Brexit implications are still unclear, the BoE’s stance indicates a front-loading of easing to effectively communicate that the BoE is in control of the situation. Even though BoE chose to cut rate by 25bps, it exceeded market expectations on several other fronts –

  • The term Funding Scheme – lending up to £100 billion to banks at a generous rate, close to the bank rate for four years –  will ensure that base rate cut is passed through to households and companies. Click here to Know More
  • Buying the UK corporate bonds, starting September, would further drive down borrowing costs for companies, helping inculcate credit growth.

Future Expectations

  • The BoJ announced that there will be a comprehensive review of its policy framework at the next meeting on September 20-21. The main intention is to do a comprehensive assessment of developments in economic activity and prices under Quantitative Easing with Negative Interest Rates. The report will form the base for a concrete interest rate decision on rates in the September or November meeting.
  • As stated in the BoE report, it is expected that they might further cut rates. Majority of members are expected to support a further rate cut and provide more easing measures at one of MPCs forthcoming meetings during the course of year..

Things to look out for

We will give some interesting trade ideas based on the above policies and market actions. Please keep a look out in this space in the coming few days.

Rishi Vora, Dinkar Mohta and Punit Parekh
Disclaimer – All the views expressed are opinions of Networth – IIMB Finance Club – members. Networth declines any responsibility for eventual losses you may incur implementing all or part of the ideas contained in this website.


Market Implications of Brexit

Britain will hold a referendum on June 23 to decide whether it wants to remain a part of the European Union (EU) or not. British PM David Cameron promised a referendum on this issue during his election campaign in 2015 as he felt that the EU had gradually evolved into a powerful bureaucracy that infringes on British sovereignty and issues of national importance such as trade, labour immigration, financial and labour regulations, and social spending. Major reasons which triggered Brexit issue are as follows:

  • Net Contributor-The UK is a net contributor to the EU budget around 8.5 billion pounds per year. Click Here to Know More
  • Immigration-The EU’s rules on free movement of labour have led to addition of 285,000 people each year (an increase of 0.4% in population) for the last 3 years which is creating social problems for Britain.
  • Red Tape – Some of the EU rules such as maximum work hours of 48/week, same working conditions for full time and part time employees, etc apply to small businesses. This creates a large hole in their balance sheets.

Although the vote is not binding, the possibility of Brexit creates a lot of uncertainty for the EU. It can significantly impact trade, investment and economic growth in the region and weaken the bloc’s effectiveness.

Escalating Brexit Fears

The Brexit polls have drawn significant attention in the financial markets for the past 3 months. Over the last 2 months, the 10-day moving average of Brexit polls has been increasing. Around the first week of June, Brexit fears escalated to such an extent that the Brexit polls trend line moved above the Bremain polls trend.

1

Source – Bloomberg
Note
1. Bloomberg Composite (Leave/ Remain) EU Index is calculated by taking an average of polls data from various surveys. The Composite Index does not include Brexit polls which do not report a value for the proportion of respondents who are Undecided.
2. The poll results are highly variable. Hence, taking a moving average gives an indication of the trend in sentiments.

Current Market Perception

Volatility has increased in the markets and investors are being more concerned. This can be explained by the following indicators:

  • Libor – OIS Spread : As the uncertainty increases, LIBOR increases as banks will be skeptical to lend. The OIS is the overnight rate and hence can be considered to be almost risk free in the UK’s case. The greater the spread (difference), the more the uncertainty. While the LIBOR-OIS spread has been fairly consistent around the world, the UK LIBOR-OIS spread has widened starting mid-April. This indicates rising concerns for the UK’s economy. Click Here to Know More

Libor

  • GBPUSD (3 month option) volatility and FTSE 100 Vol index – In anticipation of Brexit, the markets saw significant pressure in the GBPUSD currency pair and  FTSE 100 Index. This is evident from the spurt in the 3-month GBPUSD Vol and FTSE 100 Index Vol around the first week of June.

   5

Source – Bloomberg
Note – The FTSE 100 Volatility Index represents the implied volatility on the FTSE 100 Stock Index. The GBPUSD 3-month Vol uses the at-the money option implied volatility

Movements across Major Asset Classes

This is clearly a risk-off situation. In a risk-off scenario, investors are expected to move from risky assets towards safe haven assets. The appreciation in safe haven assets has been significant over the last 2-weeks which coincides with the escalation of Brexit fears. This is complemented by an outflow of funds from the UK FTSE Index.

Asset Class Item Movement observed
Currency JPYUSD/CHFUSD JPY and CHF have appreciated
Commodity Gold Appreciated
Bonds US Treasury/German Bund Yields have gone down. (Prices have increased)
Equity UK FTSE Index Index has fallen
Note – The graphs below have been adjusted to a base of 100 as on 17/3/2016. Hence, a value more than 100 means that respective asset is appreciating.

3

4

Source – Bloomberg

Implications of Potential Brexit

Trade Impact

45-50% of the UK exports go to the EU. Additional tariffs will be imposed with the main implications being on the automobile and aircraft sectors. The uncertainty regarding the trade model that Britain will follow – the Norwegian, Swiss, WTO models or create its own model – is what is concerning Global CEOs. (Click Here To Know More (Page 6))

Financial Impact

Uncertainty around the UK’s trading regime is likely to defer investment decisions and limit household spending. Brexit will impact both Britain and the EU. We expect the BOE and the ECB to ease rates and initiate some temporary liquidity programs to induce growth.

On the currency front, GBPUSD is expected to depreciate by around 15 -20%. Current account deficit of 7% of GDP and potential reduction in foreign direct investment are the major factors that might amplify currency depreciation.

Chain Reaction

We expect David Cameron to resign because he firmly wants Britain to stay in the EU as it will help in maintaining its economic relations with the rest of the world. It is expected that other countries such as Denmark, Spain and Portugal might not hold referendums to exit, but hold referendums against specific EU clauses, thereby aggravating problems for the EU.

(All the views expressed are opinions of Punit Parekh, Shreya Aggarwal and Dinkar Mohta – Finance enthusiasts at IIM Bangalore)


Recent oil market fiasco

The oil market is one of the most volatile markets because of strong linkages to economic growth of several countries, vulnerability to geopolitical concerns, a strong cartel in the form of OPEC (and the ‘swing producer’ Saudi-Arabia), linkages to currency and equity markets and rampant speculation. Last week, oil price fell below $30/barrel (for the first time in the last 12 years), a psychological lower limit propounded by many analysts. While analysts start revising their forecasts, it is important to appreciate the causes (beyond the standard argument of the glut in the oil market pushing down the oil price) for the current nosedive in oil prices.

Iran is not a major reason

The conflict between Iran and Saudi Arabia has basically aggravated the situation with both countries now competing to sell oil at cheaper price. Although, sanctions on Iran selling oil have been lifted and Iran is expected to input 500k barrels of oil/day, this will have little impact on prices in coming days, given the move was largely anticipated. Something that might impact in the short run is if Iran begins selling oil at a discount to win clients. In the long run, what needs to be seen is whether Iran is able to attract foreign investments to revitalize ageing oil fields. The bottleneck here can be if big banks (funding source) would want to restart business with Iran, given the historical fines they have given for indulging in businesses with Iranian companies.

Some of the reasons that we have identified are as follows

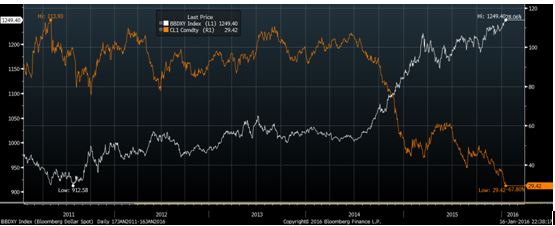
  1. USD Appreciation – In a recent report stated by Morgan Stanley, the recent drop in oil price has more to do with US dollar appreciation rather than oversupply in the market. As USD appreciates it becomes more expensive for foreign countries to buy oil. As far as supply and demand is concerned, oversupply may have pushed oil prices to the range of $50-$60. After that it is mainly because of USD appreciation. A 3.2% appreciation of trade weighted USD may decrease the oil price by 6-15% or $2- $5 per barrel. (Important thing to note here is trade weighted USD that compares value of USD against certain currencies with weights depending on the amount of trade it does with a particular country. (click here to know more ). Hence, indirectly, a depreciation in CNY is driving an increase in USD. A 15% devaluation of yuan would boost trade weighted dollar by 3.2%. The below graph shows the correlation between the dollar index and oil price movement.

yellow line – Brent oil price/ white line – dollar index

Capture

USD  has appreciated in the light of weak Chinese economy, strong US jobs data (where US added 292k jobs in December compared to expected 200k jobs) and unemployment data kept steady at 5%. Additionally, if other currencies depreciate the effect becomes compounded. On the contrary, although the Fed has said it is planning to increase interest rates 3-4 times in 2016, a rate increase late this month is highly unlikely owing to subdued inflation.

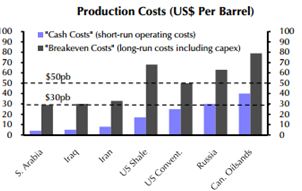
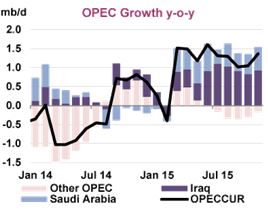
2. Production Costs – The following graphs shows estimates of short run costs and long run breakeven costs for major oil producing countries. At the current price of about $30 /barrel, the short run operating costs for major OPEC and US producers are covered. Hence, Saudi Arabia still has the leeway to push down prices to about $20/barrel, where it will make no economic sense for the US shale oil producers to continue pumping oil. Expecting oil prices to fall below $10/ barrel is unrealistic because it is not possible for Saudi Arabia to meet the entire global demand for oil. Hence, $20/ barrel is a reasonable lower bound for the volatile oil prices. hence, there is a lot of flurry in the market if $20 is going to be the threshold. One of the main reasons for Middle Eastern countries such as Saudi Arabia to not  reduce production is that their market share is increasing at such low price levels. As in the graph below, the market share of middle eastern countries is increasing whereas that of the other countries is decreasing

.Capture1.JPG      Capture3


3.  Reduction in Surplus demand from China -With  oil prices falling, China imported a record amount of crude. China’s crude imports last month (Dec’15) was equivalent to 7.85 million barrels a day, 6 percent higher than the previous record of 7.4 million in April, Bloomberg calculations show. China eased rules to allow private refiners, known as teapots, to import crude and boosted shipments to fill emergency stockpile. Now, this surplus demand from China has waned.

This data can be further validated by the fact that VLCC (very large crude container) rates have decreased as seen below. Initially, there was a surge in VLCC rates as China used to import a lot of oil because of low price.

Capture4  Capture5\

4. Capacity Constraints -Another concern which is weighing on the oil market is the physical limit to the amount of oil that can be stored. As oil prices started falling in late 2014, oil producers began storing oil in tankers in the anticipation of a rebound in oil prices in the future. The following diagram shows the increasing stockpile of oil coupled with rising supply, despite a fall in prices. The graph goes on to predict the changes in global oil inventory until 3Q2017. The implication is that global oil inventory capacity is about to be breached by late 2016 and early 2017. Moreover, unless the oil producers stop pumping oil, the increase in the inventory (although at a diminished pace) will intensify downward pressure in oil price as this oil can’t be stored and needs to be sold in the open market.

Capture6

Punit Parekh and Dinkar Mohta

All the views expressed are opinions of Networth – IIMB Finance Club – members. Networth declines any responsibility for eventual losses you may incur implementing all or part of the ideas contained in this website.
REFERENCES

http://www.zerohedge.com/news/2016-01-13/tanker-rates-tumble-last-pillar-strength-oil-market-crashes

http://www.bloomberg.com/news/articles/2016-01-11/morgan-stanley-sees-20-a-barrel-oil-on-u-s-dollar-appreciation

http://www.forbes.com/sites/michaellynch/2015/12/16/will-full-storage-tanks-crash-the-oil-price/2/#2715e4857a0b45c867ec75dc


The Recent Chinese Stock Market Crash – Part 1

The CSI 300 Shanghai index fell by more than 7% leading to stoppage of trading on 4th and 5th January 2016. Some of the main reasons for this are :  (Caveat – These are all speculative reasons and no one knows the exact driver)

  1. In August 2015, the Chinese government put a ban on short selling by major investors in order to support the equity market when the Chinese stock market was plunging. Apparently, the Chinese govt. was planning to lift this ban by 8th  Jan. Hence, in anticipation of this, there was a sentiment that a lot fund managers would short the shares of the companies that are not currently performing well. It is said that one of the reasons for a lot of weak creditworthy Chinese companies still surviving is that the Chinese government has trillions of dollars in reserves to support the banks who have invested in these companies or have provided them credit.  China’s debt to GDP ratio has swelled a lot as seen in the chart below – increasing by 50% point in the last 4 years.  Now, that the investors had gotten an opportunity, they were trying to get out of it.

graph 1

2. The Chinese PMI data was expected to come out. It didn’t fare up to its expectations. The Chinese PMI fell to 48.2 in December compared to 48.6 in November against expectations of 49.

3. The Chinese government injected $20bn in short term funds into the system to inculcate liquidity in the system in an effort to calm jittery investors. Not only has this led to devaluation of the yuan but also sent mixed signals. On one hand, the central bank intended to tighten monetary policy as part of the leadership’s plans to carry out long-pledged reforms to put the economy on a more sustainable path. On the other hand, this excess liquidity doing the reverse. This has led to further concerns that the situation has worsened a lot further declining the stock index the next day.

Explicit Effects :

1.The major explicit effects have been the downfall of the major indexes across the world – Dow Jones/ FTSE/Nikkei/Sensex to name a few. On average, they fell by 5%. One of the other reasons for the downfall is the drop in oil prices to 10 year lows.

Some of the other macro events whose effects have aggravated because of CSi 300 index drop  :

  1. Oil price downfall – Brent oil price has reduced to 10 year lows. It can be attributed to supply increase in US as well as because of China rout. The effect has been so profound that it has overcome the political conflict between Saudi Arabia and Syria. One of the reasons for this can be the fact that the markets have realised that there is enough supply of oil in the world even if Saudi disrupts oil supply.
  2. It has been speculated that North Korea has successfully tested a hydrogen bomb, potentially yielding a more powerful weapon than the kind it tested in past, raising concerns amongst its neighboring countries such as China, Japan, and South Korea. Although this hasn’t directly impacted any country, but going forward there can be potential safety issues and tougher sanctions will be placed in North Korea.

Trade Ideas 

Given the events, some of the interesting trade ideas that can be looked into in the short term are as follows

  1. JPY assets – These are safe haven assets. (link – click here to to know more about the reason). Investors generally resort to to it during uncertain times. As see in the graph below, JPY has appreciated by around 2.68% since the start of the new year (yellow line – usdcny/ white line – usd jpy)                                        usdjpy

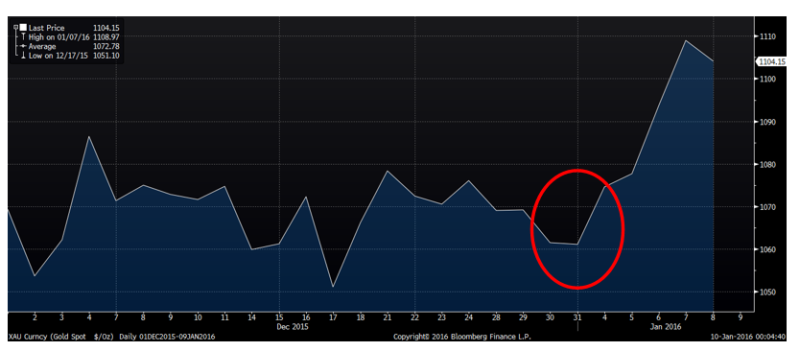
2. Gold is another area that we should look into. Prices of gold have risen by 4% since start of the year. It is also considered as a safe haven during these tough times.

gold

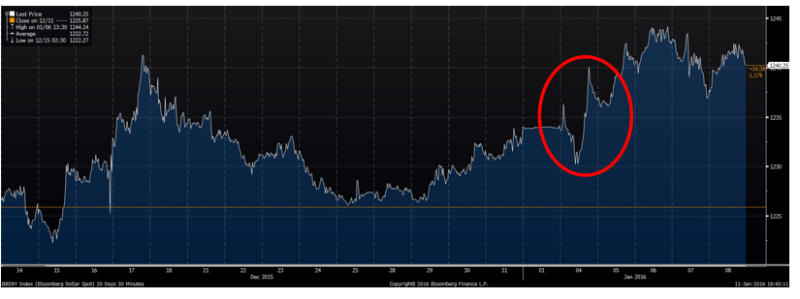
3. US Dollar/ US Treasury –  The US stocks are down by around 5%. Moreover, the US economy has added 292k jobs last month compared to the expected 200k. Hence, this is a positive sign for the US economy. As seen in the BBDXY index ( performance of USD against a basket of currencies – click here to know more), USD has appreciated against the basket and is also a safe haven in current circumstances. Furthermore, US treasury is another safe haven during these times.

bbdxt index

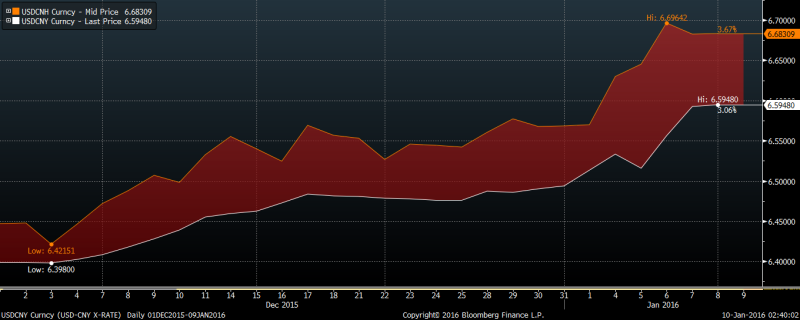
4. Divergence between CNH and CNY – In order to support CNY, the Chinese government stepped in to prevent further devaluation after stock market crash. However, CNH wasn’t supported and the divergence increased as seen in the graph below. Hence, traders can take advantage of this situation in short term.

yellow line – cnh/ white line – cny

cnhcny

Stay tuned for our second part which gives an in depth analysis of the Chinese stock market and its relation with real economy.

Punit Parikh and Dinkar Mohta.
(Special Thanks to Pranav Raheja for his valuable inputs)
All the views expressed are opinions of Networth – IIMB Finance Club – members. Networth declines any responsibility for eventual losses you may incur implementing all or part of the ideas contained in this website.

A critique on US Fed Rate Increase :

The Fed declined to increase rates 3 months ago on conditions that: ” recent global and financial developments may restrain economic activity”. But over these 3 months a lot of things have further worsened:

  1. Commodity prices have further tumbled – Brent falling to below (a seven year low), iron orse falling to below $40/metric tonne
  2. Risky credit has become a lot expensive. The difference between high yield corporate bonds and treasury yields have increased from 7% to about 19%. This ii rarely so high until in recession. The main reason for this is the drop in oil prices which has eaten up the balance sheet of a lot of oil & gas companies.

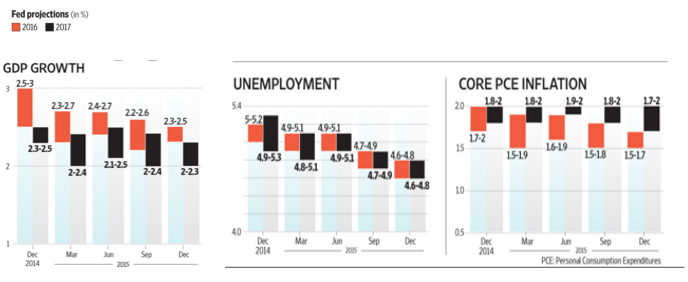
As we can see in the graph below, the Fed GDP projections have decreased as well as inflation measures. The Fed’s projections of both economic growth and core inflation are materially lower from a year ago. Growth projections for 2016, for instance, now stand at 2.3-2.5%, compared with 2.5-3% a year ago. Core inflation is expected to fall between 1.5% and 1.7%, compared with 1.7-2% a year ago. So, then why has the fed increased its interest rate this time?

Fed graphs

Some of the factors supporting the Fed rate rise :

  1. One of the important factors supporting the economy is the labor market tightening. US unemployment has fallen consistently close to 5%.`Even though there has been external weakness, the domestic environment seems solid.
  2. Even though inflation continues to run below its 2% target, partly reflecting decline in energy prices and partly in prices of non-energy imports, the Fed thinks that this is transitionary and will improve in the future. They will “carefully monitor” the inflation rate before they rise fed funds rate further.
  3. It takes some time for policy actions to affect future outcomes. There is some lag in the process. Hence, it might be the right time to raise.

Some interesting facts emerging from the meeting:

  1. New projections show Fed officials (according to the dot plot) expect the fed-funds rate to creep upto 1.375% by the end of 2016, according to the median projection of 17 officials, to 2.375% by the end of 2017 and 3.25% in three years. That implies four quarter-percentage-point interest rate increases next year, four the next and three or four the following.  However, market expectations is 3 in the best case scenario. Same as September hike. Hence, this is big discrepancy in the rates.
  1. The Fed has created a ton of excess reserves in the balance sheet.  It is important to note that if investors lend the Fed more money than the Fed was willing to borrow, the central bank wouldn’t be able to keep rates within target range. The Federal Reserve has removed the daily limit on aggregate borrowings through its overnight reverse repurchase facility, previously set at $300 billion. The size of the facility will be “limited only by the value of Treasury securities held outright in the System Open Market Account that are available for such operations and by a per-counterparty limit of $30 billion per day. In this system, The fed will sell securities to various institutions that come under the FOMC purview and borrow cash. The next day it will buy securities and return the cash at an interest rate between 0.25-0.5 %. This will help smoothen the process.

References :

http://www.ft.com/intl/cms/s/3/4dd0dd7c-a389-11e5-bc70-7ff6d4fd203a.html#axzz3ufywQ1L6

http://www.federalreserve.gov/newsevents/press/monetary/20151216a.htm

http://www.livemint.com/Money/h3RkkYuVyDszFNyt9ANlxN/The-anomaly-behind-the-Feds-rate-hike.html