Recent oil market fiasco

The oil market is one of the most volatile markets because of strong linkages to economic growth of several countries, vulnerability to geopolitical concerns, a strong cartel in the form of OPEC (and the ‘swing producer’ Saudi-Arabia), linkages to currency and equity markets and rampant speculation. Last week, oil price fell below $30/barrel (for the first time in the last 12 years), a psychological lower limit propounded by many analysts. While analysts start revising their forecasts, it is important to appreciate the causes (beyond the standard argument of the glut in the oil market pushing down the oil price) for the current nosedive in oil prices.

Iran is not a major reason

The conflict between Iran and Saudi Arabia has basically aggravated the situation with both countries now competing to sell oil at cheaper price. Although, sanctions on Iran selling oil have been lifted and Iran is expected to input 500k barrels of oil/day, this will have little impact on prices in coming days, given the move was largely anticipated. Something that might impact in the short run is if Iran begins selling oil at a discount to win clients. In the long run, what needs to be seen is whether Iran is able to attract foreign investments to revitalize ageing oil fields. The bottleneck here can be if big banks (funding source) would want to restart business with Iran, given the historical fines they have given for indulging in businesses with Iranian companies.

Some of the reasons that we have identified are as follows

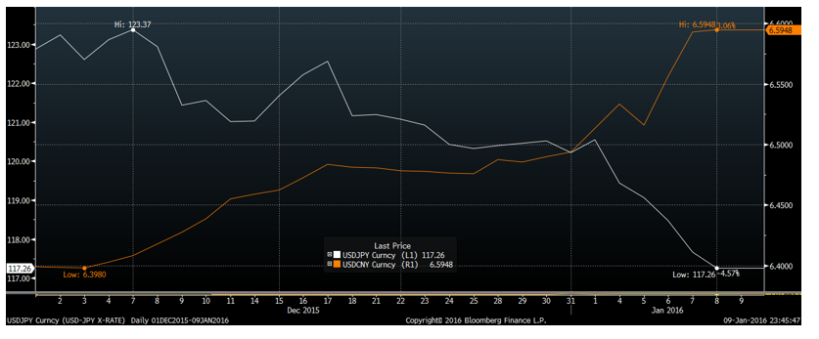
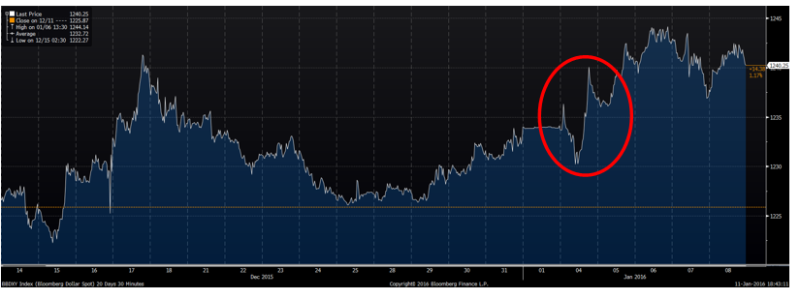
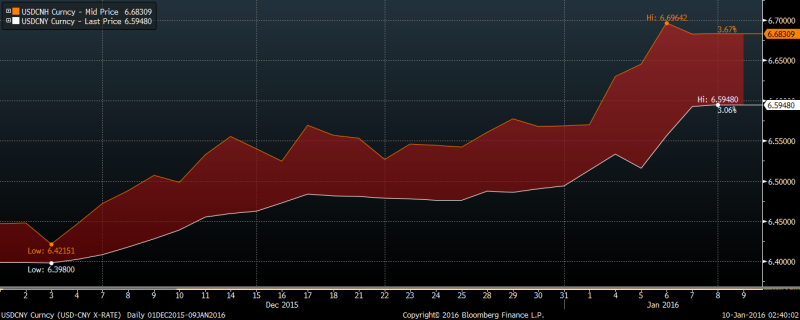
  1. USD Appreciation – In a recent report stated by Morgan Stanley, the recent drop in oil price has more to do with US dollar appreciation rather than oversupply in the market. As USD appreciates it becomes more expensive for foreign countries to buy oil. As far as supply and demand is concerned, oversupply may have pushed oil prices to the range of $50-$60. After that it is mainly because of USD appreciation. A 3.2% appreciation of trade weighted USD may decrease the oil price by 6-15% or $2- $5 per barrel. (Important thing to note here is trade weighted USD that compares value of USD against certain currencies with weights depending on the amount of trade it does with a particular country. (click here to know more ). Hence, indirectly, a depreciation in CNY is driving an increase in USD. A 15% devaluation of yuan would boost trade weighted dollar by 3.2%. The below graph shows the correlation between the dollar index and oil price movement.

yellow line – Brent oil price/ white line – dollar index

Capture

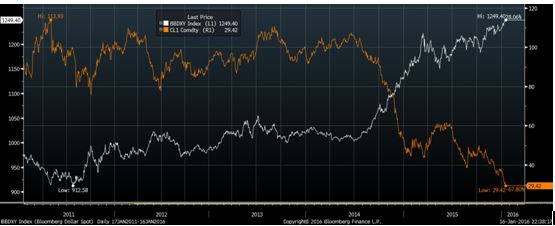
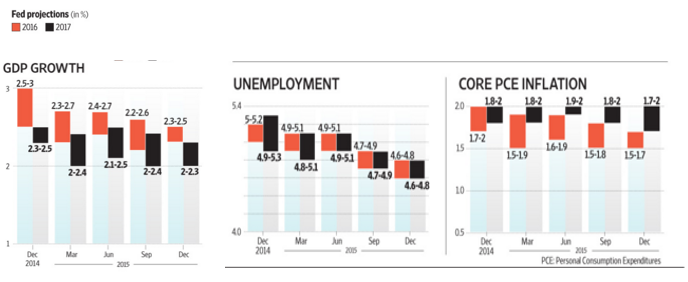
USD  has appreciated in the light of weak Chinese economy, strong US jobs data (where US added 292k jobs in December compared to expected 200k jobs) and unemployment data kept steady at 5%. Additionally, if other currencies depreciate the effect becomes compounded. On the contrary, although the Fed has said it is planning to increase interest rates 3-4 times in 2016, a rate increase late this month is highly unlikely owing to subdued inflation.

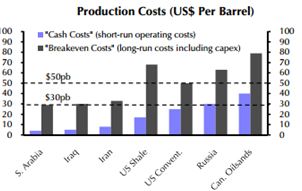
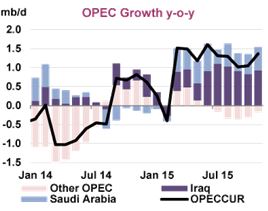
2. Production Costs – The following graphs shows estimates of short run costs and long run breakeven costs for major oil producing countries. At the current price of about $30 /barrel, the short run operating costs for major OPEC and US producers are covered. Hence, Saudi Arabia still has the leeway to push down prices to about $20/barrel, where it will make no economic sense for the US shale oil producers to continue pumping oil. Expecting oil prices to fall below $10/ barrel is unrealistic because it is not possible for Saudi Arabia to meet the entire global demand for oil. Hence, $20/ barrel is a reasonable lower bound for the volatile oil prices. hence, there is a lot of flurry in the market if $20 is going to be the threshold. One of the main reasons for Middle Eastern countries such as Saudi Arabia to not  reduce production is that their market share is increasing at such low price levels. As in the graph below, the market share of middle eastern countries is increasing whereas that of the other countries is decreasing

.Capture1.JPG      Capture3


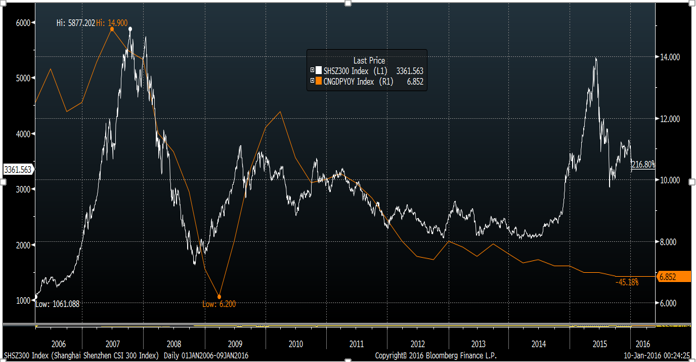
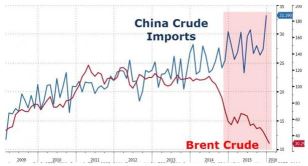
3.  Reduction in Surplus demand from China -With  oil prices falling, China imported a record amount of crude. China’s crude imports last month (Dec’15) was equivalent to 7.85 million barrels a day, 6 percent higher than the previous record of 7.4 million in April, Bloomberg calculations show. China eased rules to allow private refiners, known as teapots, to import crude and boosted shipments to fill emergency stockpile. Now, this surplus demand from China has waned.

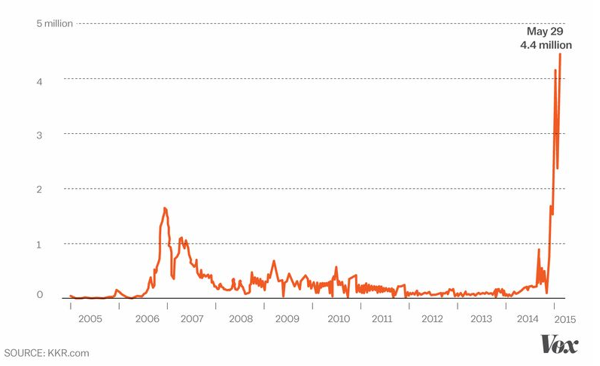
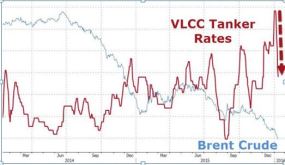
This data can be further validated by the fact that VLCC (very large crude container) rates have decreased as seen below. Initially, there was a surge in VLCC rates as China used to import a lot of oil because of low price.

Capture4  Capture5\

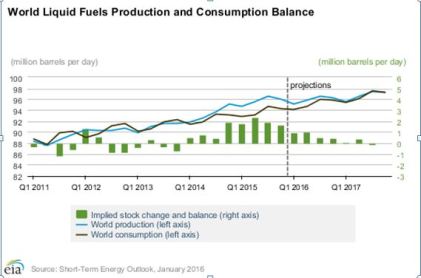
4. Capacity Constraints -Another concern which is weighing on the oil market is the physical limit to the amount of oil that can be stored. As oil prices started falling in late 2014, oil producers began storing oil in tankers in the anticipation of a rebound in oil prices in the future. The following diagram shows the increasing stockpile of oil coupled with rising supply, despite a fall in prices. The graph goes on to predict the changes in global oil inventory until 3Q2017. The implication is that global oil inventory capacity is about to be breached by late 2016 and early 2017. Moreover, unless the oil producers stop pumping oil, the increase in the inventory (although at a diminished pace) will intensify downward pressure in oil price as this oil can’t be stored and needs to be sold in the open market.

Capture6

Punit Parekh and Dinkar Mohta

All the views expressed are opinions of Networth – IIMB Finance Club – members. Networth declines any responsibility for eventual losses you may incur implementing all or part of the ideas contained in this website.
REFERENCES

http://www.zerohedge.com/news/2016-01-13/tanker-rates-tumble-last-pillar-strength-oil-market-crashes

http://www.bloomberg.com/news/articles/2016-01-11/morgan-stanley-sees-20-a-barrel-oil-on-u-s-dollar-appreciation

http://www.forbes.com/sites/michaellynch/2015/12/16/will-full-storage-tanks-crash-the-oil-price/2/#2715e4857a0b45c867ec75dc


The Recent Chinese Stock Market Crash – Part 2

The following excerpt from the Economist aptly portrays the current world economic and stock market scenario:-

The global economy is right in the middle of a significant transition, in other words, as rich economies try to normalise policy, China tries to rebalance it. That transition is proving a difficult one for policymakers to manage, and markets are wobbling under the strain.

Chinese Stock Market Crash – Bubble created in 2014 is burst

The Chinese stock market has defied financial gravity for far too long. What shoots up for no reason, almost certainly tumbles irrespective of what the government may do to keep it aloft. Unlike Western stock markets, the Chinese markets are characterised by 80% retail investors who tend to ride on speculations rather than long-term wealth creation. No wonder, as is observed in Figure 1, the stock market has witnessed significant boom and bust cycles.

PIC 1

Fig. 1: Time series plot of CSI 300 Shanghai Composite Index (white line) and real GDP growth rate (yellow line)

  • Post 2007 stock market bubble, the index has remained gloomy for about seven years.
  • In mid-2014, backed by increased availability of credit by the government regulators, coupled with the fall in real estate prices (which had been the mainstay investment option until then), the individual investors pushed the stock prices to unsustainable levels. The index grew by 150 % in 12 months till June, 2015.
  • The risks regarding overvalued shares and signs of an economic slowdown, ultimately brought the momentum to a shuddering halt in the infamous ‘Black Monday’ when the stock market tumbled from its seven year peak.

A research by three London Business School professors has questioned the conventional argument for superior economic growth driving stock market returns in emerging markets. They have pointed out that economic growth and equity returns are not correlated at all. [1] In the Chinese context, a paper titled ‘Explaining the disconnection between China’s economic growth and stock market performance’ shows that correlation between market returns and future GDP growth are statistically insignificant and lower than that of developed economies. [2] Mere observation of Figure 1 above can lead to the same inference.

  • When the market crashed in October 2007, GDP growth numbers were stable.
  • Again, in 2014, when the economy registered the lowest GDP growth in the last 24 years, the stock market was rallying. According to the Economist – “With declining GDP and corporate debt on the rise, the values of the Chinese stock markets have appeared ‘increasingly disconnected from reality’” The roller coaster ride of the stock market in the last year is, therefore, because of the speculative behaviour of investors in the market, which is at best peripheral to the real Chinese economy. Indeed, China’s “Black Monday” and this week’s crash were more a product of the wider economic concerns, than a trigger for any kind of economic collapse.

Chinese markets are structurally different from their Western peers

Chinese stock markets are relatively unimportant within the Chinese system. Only 5-10% of all capital raisings is by equity issues. The bulk of the funding is from debt, essentially from banks. Besides, the stock market is small relative to the size of the economy. Total free float value (market value of shares available for trading) as a percentage of GDP is considered the best metric to measure the size of the stock market relative to the economy. The value of this metric, historically, is around 25-35%, well below that of USA (150%) and most developed economies (85-100%). [3] This is mainly because about two-thirds of the market capitalisation is owned by the government and hence is not freely traded in the market.

The limited amount of institutional investment and the absence of international investment means that the market does not get the level of analytical treatment that other markets might. Moreover, an average Chinese does not rely on the market as an investment tool. Only one-fifth of household wealth is invested in stocks, whereas the corresponding figure is 60% in USA. [3]

Retail investors and first-time punters are contributing to market volatility

Figure 2 shows that there was a spurt in new stock trading accounts during the bull market of 2006-07. However, in late 2014 there was a mercurial growth in the new accounts opened per week. In fact, more than 40 million accounts were opened between June 2014 and May 2015. There are more stock traders in China (90 million) than members of the Communist Party! [4]

PIC 2

Fig. 2: New share trading accounts per week

The generational shift in China’s investor base is another intriguing feature. The proportion of people with stock-trading accounts who were under the age of 30 has risen from 27.8% in 2004 to 36.1% by 2013. In the first quarter of 2015, 62% of new trading accounts were opened by people born after 1980 while just 5% were opened by those above the age of 55. According to the Economist:-

Having experienced big crashes in the past, China’s pensioners were more wary about jumping back into the fray. For the young, who have less memory of past turbulence and more disposable income, investing in shares beckoned as a shortcut to riches.

A survey by Shenzen stock exchange reported that 44% of young investors relied on tips from friends while making trading decisions, whereas a third of the other investors trusted word of mouth. The presence of so many first-time investors are driving daily price swings in the Chinese stock markets. [5]

Government’s response to the market crash matters more than the crash itself

The bottom-line, therefore, is that the impact of the stock market crunch should not be overestimated. The quintessential long-term risk is the accelerating economic slowdown. The renowned American investor, George Soros is of the following view:-

China’s flagging economy and subsequent devaluation of its currency were undermining financial stability in ways reminiscent of the global crisis of 2008.

In 2015, the GDP growth rate hovered around 7%. The recent figures from the much-observed manufacturing sector suggest the outlook is far from positive. A recent independent analysis found that the situation can be worse than what is projected by the official numbers.

According to Sydney Morning Herald:  China’s stock market crash doesn’t really matter for its economy, but its government’s response to it might. That’s because policymakers who have made this many mistakes with their markets might make one with their economy too – and that’s what matters.

Despite multiple interventions by the Government, the stock market after the Black Monday crash, temporarily recovered before tumbling again this week. The government spent 5 trillion RMB (US$800 billion or the equivalent of almost 10% of China’s GDP in 2014) from its reserves, to prop up its wobbly stock markets. [6]The real danger lies in the fact that the government’s failure to save the market could undermine people’s confidence which could thereby affect real investment and consumption, further fuelling the economic slowdown.

Inconsistent market interventions by the Government

On a different note, there is a contention that the government’s efforts have actually hindered the recovery due to the deployment of ad-hoc measures rather than structural market reforms. For instance, to cap the intense volatility in markets, the circuit breaker mechanism was employed. On WeChat, the widely-used messaging and social network platform, a joke circulated:

“Many people ask, ‘What is the circuit breaker mechanism?’ Actually it’s like this: You bring Rmb 3,000 to play mahjong, but you lose it all in half an hour. The game is paused for 15 minutes so you can pop downstairs to the ATM to withdraw another Rmb 5,000. You come back and quickly lose that too. Then the winner says, ‘Your luck is too bad, let’s just end the game for today’.”

The circuit breakers essentially meant that anytime stocks start getting close to the first level, say down 4 per cent, people race to sell anything they might want to out of fear that they won’t be able to if they wait a little longer. That, of course, sends stocks down to the 5 per cent threshold (first level), which then gives them 15 minutes to figure out how to sell everything else before the next circuit breaker (at the 7% threshold).

In other words, the rush to beat the circuit breakers made the market more likely to hit them. The circuit breakers, thus, magnified market volatility which is in contrast to their objective. It is no surprise, then, that just four days after putting them in place, the government got rid of them.

Serious questions raised on the shift to market based economy

The real issue is that the retail investors are used to government protection in case of downsides in the market. For instance, despite unrealistically high P/E ratios in the market-bubble phase, investors jumped on the stock market bandwagon on the belief that the bull market had the backing of the government which would backstop any losses. When investors started to doubt the government’s level of support (officials were reining in the margin lending mechanism which was the cause for the bubble), there was a huge sell-off.

The need for strong government intervention raises serious questions about China’s plan to liberalise its financial system to bring in greater competition and to turn yuan into an international currency. Although the stock market does not really affect the real economy, there is a good reason for concern, if not panic. The events of the last year have raised fundamental questions about an economy which accounts for about 15% of global GDP. The ability of the government to manage the market gyrations and animal spirits has come under the scanner. A sharp Chinese slowdown will be highly probable if the government’s reaction to the market turmoil essentially stymies the structural economic reforms which are essential for the desired rebalancing (from export and investment led economy to domestic consumption- led economy).

In addition, Beijing will now have to respond to a fundamental question that it has avoided for years: will China become a well-functioning market economy, or will state capitalism continue to drive the operations of the world’s second largest economy?

Punit Parekh and Dinkar Mohta

All the views expressed are opinions of Networth – IIMB Finance Club – members. Networth declines any responsibility for eventual losses you may incur implementing all or part of the ideas contained in this website.

References

  1. http://www.economist.com/blogs/buttonwood/2014/02/growth-and-markets
  2. http://www.saif.sjtu.edu.cn/sites/default/files/images/ymzhou/paper_736.pdf
  3. http://forbesindia.com/printcontent/41305
  4. http://www.vox.com/2015/7/8/8911519/china-stock-market-charts
  5. http://www.economist.com/blogs/freeexchange/2015/07/chinas-wild-stockmarket
  6. https://blogs.nottingham.ac.uk/chinapolicyinstitute/2015/08/27/what-role-does-the-stock-market-play-in-the-chinese-economy

The Recent Chinese Stock Market Crash – Part 1

The CSI 300 Shanghai index fell by more than 7% leading to stoppage of trading on 4th and 5th January 2016. Some of the main reasons for this are :  (Caveat – These are all speculative reasons and no one knows the exact driver)

  1. In August 2015, the Chinese government put a ban on short selling by major investors in order to support the equity market when the Chinese stock market was plunging. Apparently, the Chinese govt. was planning to lift this ban by 8th  Jan. Hence, in anticipation of this, there was a sentiment that a lot fund managers would short the shares of the companies that are not currently performing well. It is said that one of the reasons for a lot of weak creditworthy Chinese companies still surviving is that the Chinese government has trillions of dollars in reserves to support the banks who have invested in these companies or have provided them credit.  China’s debt to GDP ratio has swelled a lot as seen in the chart below – increasing by 50% point in the last 4 years.  Now, that the investors had gotten an opportunity, they were trying to get out of it.

graph 1

2. The Chinese PMI data was expected to come out. It didn’t fare up to its expectations. The Chinese PMI fell to 48.2 in December compared to 48.6 in November against expectations of 49.

3. The Chinese government injected $20bn in short term funds into the system to inculcate liquidity in the system in an effort to calm jittery investors. Not only has this led to devaluation of the yuan but also sent mixed signals. On one hand, the central bank intended to tighten monetary policy as part of the leadership’s plans to carry out long-pledged reforms to put the economy on a more sustainable path. On the other hand, this excess liquidity doing the reverse. This has led to further concerns that the situation has worsened a lot further declining the stock index the next day.

Explicit Effects :

1.The major explicit effects have been the downfall of the major indexes across the world – Dow Jones/ FTSE/Nikkei/Sensex to name a few. On average, they fell by 5%. One of the other reasons for the downfall is the drop in oil prices to 10 year lows.

Some of the other macro events whose effects have aggravated because of CSi 300 index drop  :

  1. Oil price downfall – Brent oil price has reduced to 10 year lows. It can be attributed to supply increase in US as well as because of China rout. The effect has been so profound that it has overcome the political conflict between Saudi Arabia and Syria. One of the reasons for this can be the fact that the markets have realised that there is enough supply of oil in the world even if Saudi disrupts oil supply.
  2. It has been speculated that North Korea has successfully tested a hydrogen bomb, potentially yielding a more powerful weapon than the kind it tested in past, raising concerns amongst its neighboring countries such as China, Japan, and South Korea. Although this hasn’t directly impacted any country, but going forward there can be potential safety issues and tougher sanctions will be placed in North Korea.

Trade Ideas 

Given the events, some of the interesting trade ideas that can be looked into in the short term are as follows

  1. JPY assets – These are safe haven assets. (link – click here to to know more about the reason). Investors generally resort to to it during uncertain times. As see in the graph below, JPY has appreciated by around 2.68% since the start of the new year (yellow line – usdcny/ white line – usd jpy)                                        usdjpy

2. Gold is another area that we should look into. Prices of gold have risen by 4% since start of the year. It is also considered as a safe haven during these tough times.

gold

3. US Dollar/ US Treasury –  The US stocks are down by around 5%. Moreover, the US economy has added 292k jobs last month compared to the expected 200k. Hence, this is a positive sign for the US economy. As seen in the BBDXY index ( performance of USD against a basket of currencies – click here to know more), USD has appreciated against the basket and is also a safe haven in current circumstances. Furthermore, US treasury is another safe haven during these times.

bbdxt index

4. Divergence between CNH and CNY – In order to support CNY, the Chinese government stepped in to prevent further devaluation after stock market crash. However, CNH wasn’t supported and the divergence increased as seen in the graph below. Hence, traders can take advantage of this situation in short term.

yellow line – cnh/ white line – cny

cnhcny

Stay tuned for our second part which gives an in depth analysis of the Chinese stock market and its relation with real economy.

Punit Parikh and Dinkar Mohta.
(Special Thanks to Pranav Raheja for his valuable inputs)
All the views expressed are opinions of Networth – IIMB Finance Club – members. Networth declines any responsibility for eventual losses you may incur implementing all or part of the ideas contained in this website.

A critique on US Fed Rate Increase :

The Fed declined to increase rates 3 months ago on conditions that: ” recent global and financial developments may restrain economic activity”. But over these 3 months a lot of things have further worsened:

  1. Commodity prices have further tumbled – Brent falling to below (a seven year low), iron orse falling to below $40/metric tonne
  2. Risky credit has become a lot expensive. The difference between high yield corporate bonds and treasury yields have increased from 7% to about 19%. This ii rarely so high until in recession. The main reason for this is the drop in oil prices which has eaten up the balance sheet of a lot of oil & gas companies.

As we can see in the graph below, the Fed GDP projections have decreased as well as inflation measures. The Fed’s projections of both economic growth and core inflation are materially lower from a year ago. Growth projections for 2016, for instance, now stand at 2.3-2.5%, compared with 2.5-3% a year ago. Core inflation is expected to fall between 1.5% and 1.7%, compared with 1.7-2% a year ago. So, then why has the fed increased its interest rate this time?

Fed graphs

Some of the factors supporting the Fed rate rise :

  1. One of the important factors supporting the economy is the labor market tightening. US unemployment has fallen consistently close to 5%.`Even though there has been external weakness, the domestic environment seems solid.
  2. Even though inflation continues to run below its 2% target, partly reflecting decline in energy prices and partly in prices of non-energy imports, the Fed thinks that this is transitionary and will improve in the future. They will “carefully monitor” the inflation rate before they rise fed funds rate further.
  3. It takes some time for policy actions to affect future outcomes. There is some lag in the process. Hence, it might be the right time to raise.

Some interesting facts emerging from the meeting:

  1. New projections show Fed officials (according to the dot plot) expect the fed-funds rate to creep upto 1.375% by the end of 2016, according to the median projection of 17 officials, to 2.375% by the end of 2017 and 3.25% in three years. That implies four quarter-percentage-point interest rate increases next year, four the next and three or four the following.  However, market expectations is 3 in the best case scenario. Same as September hike. Hence, this is big discrepancy in the rates.
  1. The Fed has created a ton of excess reserves in the balance sheet.  It is important to note that if investors lend the Fed more money than the Fed was willing to borrow, the central bank wouldn’t be able to keep rates within target range. The Federal Reserve has removed the daily limit on aggregate borrowings through its overnight reverse repurchase facility, previously set at $300 billion. The size of the facility will be “limited only by the value of Treasury securities held outright in the System Open Market Account that are available for such operations and by a per-counterparty limit of $30 billion per day. In this system, The fed will sell securities to various institutions that come under the FOMC purview and borrow cash. The next day it will buy securities and return the cash at an interest rate between 0.25-0.5 %. This will help smoothen the process.

References :

http://www.ft.com/intl/cms/s/3/4dd0dd7c-a389-11e5-bc70-7ff6d4fd203a.html#axzz3ufywQ1L6

http://www.federalreserve.gov/newsevents/press/monetary/20151216a.htm

http://www.livemint.com/Money/h3RkkYuVyDszFNyt9ANlxN/The-anomaly-behind-the-Feds-rate-hike.html