Blog by: Ayush Agrawal & Rishi Vora

Have you ever wondered what makes currencies tick? Why is it that most people find FX pairs the most difficult asset class to understand? Is it one among the macroeconomic fundamentals, interest rate parities, carry trades, technicals, risk off scenarios that dominate FX trading or is it a mix of all these factors which ultimately transpires into pips movement. Most people (even prudent investors) believe that FX movements are random. In this blog, we try and unfold the theory that lies behind currency pair movements by analyzing EURUSD in the long term (1 year).
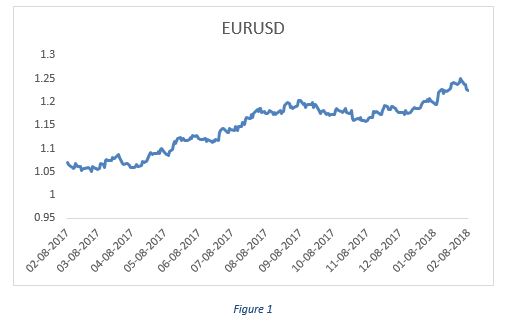
As can be seen from the Fig 1 below, EURUSD has appreciated over the last one year.
US Macroeconomic Overview
The US economy has been doing well since 2013 which prompted fed to go for tapering of its bond-buying program (Quantitative Easing) in December’13 thereby decreasing the supply of USD and resulting in a stronger dollar. Macroeconomic data points in the last one year (see figures below) have clearly shown strong US economic fundamentals.
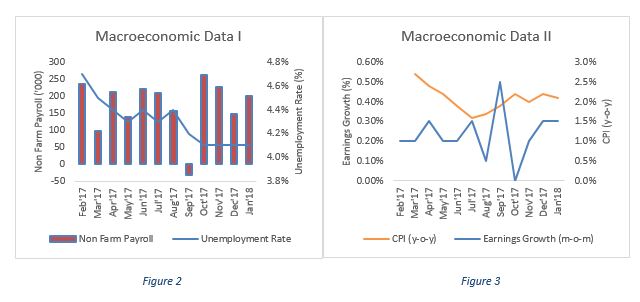
As can be seen from Fig 2, the non-farm payroll numbers which indicate new non-farm jobs created in the US have been a steady month over a month except for a temporary shock in September’17 when the US was hit by Harvey hurricane. This has been supported by a steady fall in the unemployment rate which is now at an all-time low of 4.1% post-2008 financial crisis. In fact, economists believe that the slack in labor market has been constantly narrowing over the last one year and that it is expected to reach full employment soon.
The US fed in its monetary policy follows inflation targeting which mandates it to maintain CPI at 2%. The CPI numbers in Fig 3 indicate that inflation has been on the higher side in the US mostly due to high consumer demand. This coupled with steady earnings growth again point to a strong economic recovery in the US. Moreover, the expectations of a reduction in corporate tax rate have further driven equities, pushed inflation higher and have resulted in anticipation of a stronger economy in the long run.
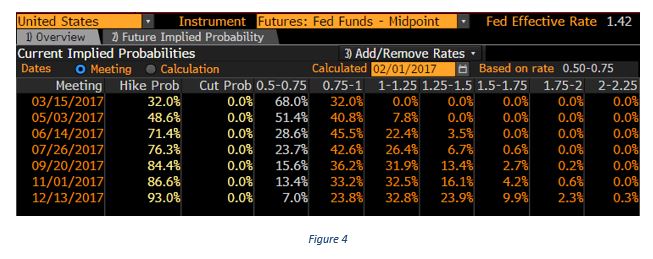
If we go by the fundamentals of macroeconomics, a stronger US economy supported by expectations (32.8% probability) of two rate hikes in 2017 (Fig 4) should lead to capital inflows and hence USD appreciation. However clearly, this is not the case. Why? In order to understand this, we would need to look at what was happening in Eurozone meanwhile.
Eurozone Macroeconomic Overview
The European Central Bank (ECB) carried out quantitative easing much later than the Federal Reserve. As a result, the economic recovery in Eurozone started late than that in the US. However in the last one year, from Germany’s macroeconomic data, we can see that QE in Eurozone has yielded good results and hence has resulted in the recovery we are witnessing today.
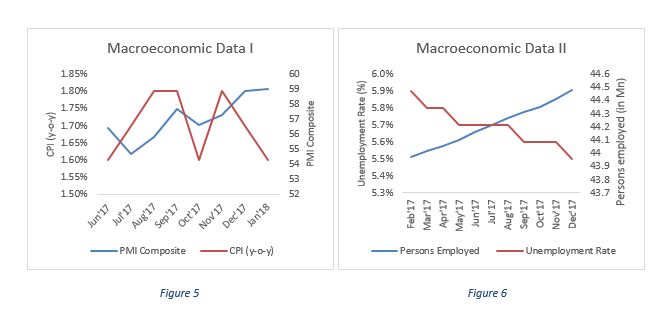
The CPI data (Fig 5) has been steady at about 1.6% with ECB expecting it to reach the 2% target in 2018 given the improving PMI, steadily decreasing unemployment rate and strong employment numbers (Fig 6). Due to the strong macroeconomic fundamentals and communication from ECB policy statements, the expectations of tapering of the bond buying program have been growing strong over the last one year. Since both the US and Eurozone economies have been doing well, we need to compare how the expectations of rate hikes in the US have pared in comparison to ECBs taper tantrum in the investor community to understand the movement in EURUSD.
Let us now look at the factors which have driven investor confidence in the US and Eurozone economies in the last one year.
Factor 1: Percentage change in Yield Spreads
Figure 7 below shows percentage change in yield spreads between 10 year US Treasury bonds and 10 year German Bunds. 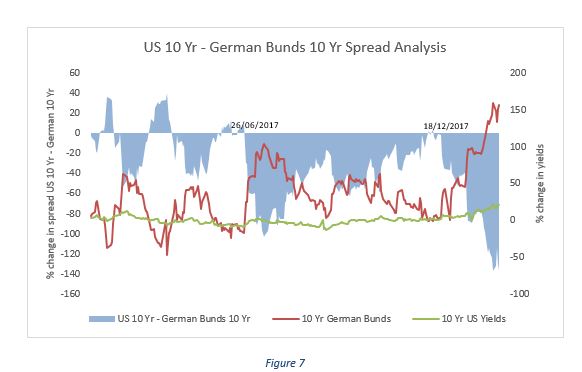
The percentage change in spreads has considerably widened in June & December 2017. This means that the rate of increase in German bunds is more than US treasury yields. Since the investors were earning higher returns on a relative basis in Germany, demand for Euro increased. Moreover, strong macroeconomic data in the Euro region and taper tantrums by ECB forced investors to unwind their carry trades thereby further strengthening Euro.
Factor 2: Historical Yield Range Bounds
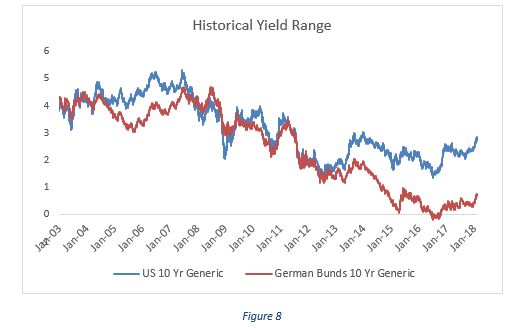
Figure 8 above shows the historical yield range bound of US 10 year Treasury bonds & German 10-year bunds. Since the difference between upper bound & current yields is much higher in case of German bunds as compared to US Treasury yields, we believe that there is more upside potential for German Bunds. This might be another factor which resulted in an appreciation of Euro against US dollar.
Factor 3: Yield Curve
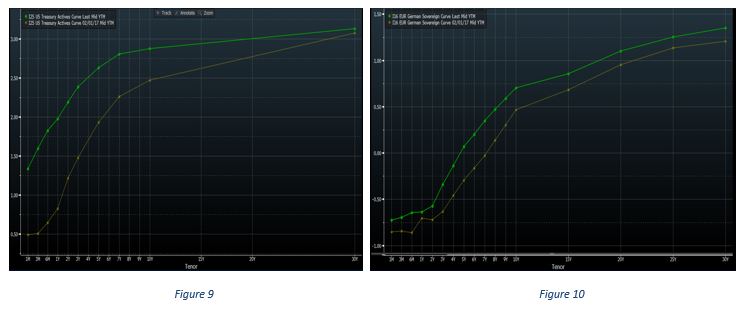
The yield curve of US treasuries (Fig 9) & German bunds (Fig 10) as on February 2017 & 2018 indicates that while 1 year US yields have risen more than 10-year yields but same is not true for German yields. The spread between US 10 year & 1-year yields have decreased from 164.7 to 90.1 basis points and that of German 10 year & 1-year yields have increased from 117.2 to 134.2 basis points. This yield curve flattening in the US shows the declining confidence of investors in the long-term growth prospects which again has contributed to the weakening of USD.
All the above factors indicate the various possible reasons as to why USD has depreciated with respect to Euro over the last one year. Though, the list of factors might not be exhaustive but these certainly form the contours of analyzing a currency pair. The analysis that we have carried out so far is historical in nature.
In the next part of this blog, we will talk about the forward-looking analysis of currency movement and its key determinants. Finally, based on this analysis we will look at a trade idea on EURUSD pair for a time horizon of 1 year.
Disclaimer – All the views expressed are opinions of Networth – IIMB Finance Club – members. Networth declines any responsibility for eventual losses you may incur implementing all or part of the ideas contained in this website.
