Credit Landscape in India

Blog by: Shashwat Gupta & Himani Gupta (PGP 2018-20)

Introduction

The past few months have been marred with growing tighter money conditions and fears of contagion following IL&FS debt crisis, and has put a dent on the credit landscape in the world’s fastest growing economy.

The headlines on ‘Corporate loan growth revival’, ‘credit flow to industry, to NBFCs, priority sector, and the feuds between Government and RBI asks out more questions than it answers. So what exactly are these lending vehicles? How does bank divide loans among these sectors, how have they fared and why is Government and RBI at odds with one another? Let’s venture into the credit economy of India.

Gross Bank Credit

Bank Credit is the total borrowing capacity bank provides to its borrowers. Gross Bank Credit is the aggregate amount of credit made available to individuals or businesses from India’s various scheduled commercial banks, fueling production and consumption, and in effect the overall economy.

Gross Bank Credit, as on Oct 26, 2018 stands at Rs. 80.57 lakh crore, about 45% of the country’s GDP! Monumental as it sounds, it had grown a bit sluggish at ~6% from Oct ‘16 to Oct’17 but returned to its double-digit annual growth this year at near 13%.
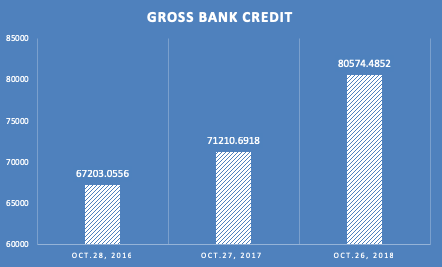
*in billion Rs.

Source: RBI

Let’s break open this shell. What all does it comprise? The following image gives a pictorial view.

Food Credit

Food credit is the loan provided to the Food Corporation of India (FCI) and state government agencies to procure food grains from farmers, implementing the food policy of India. FCI does the same through supporting operations, procurement, storage, preservation, movement and distribution of food grains throughout the nation through the public distribution service (PDS) The loans are repaid after the central government releases the food subsidy, and is hence perceived to be a zero risk lending by banks.

The quantum of food credit is determined by external factors like the nature of monsoons during the year, the borrowing made, size of the market surplus, apart from the government’s food grains procurement plans.

Besides availing short term loans that are unsecured, FCI avails of a cash credit limit (CCL), fixed by the RBI, that it borrows from banks through a consortium led by the State Bank of India. These limits are fixed against the value of food grain stocks held with the corporation.

It was in 2016, when RBI suspected that the stock of foodgrains against which the loans are extended were not adequate to cover the value of the loan. It had then asked the banks to treat these ‘safe loans’ as potential Non Performing Loans and to set aside some funds. This had then come as a rude shock to the banks who were already distressed with the growing corporates NPAs.

As on Oct ‘18, Food credit is at Rs. 0.55 lakh crores or less than 1% of the total Gross Bank Credit provided.

Non Food Bank Credit (NFBC)

Anything apart from food credit comes under the gambit of Non Food Bank Credit. As seen above, more than 99% of the Gross Bank Credit goes to NFBC. It amounted to Rs. 80.02 lakh crores, growing at a strong rate of 13.4% y-o-y as on Oct ‘18.

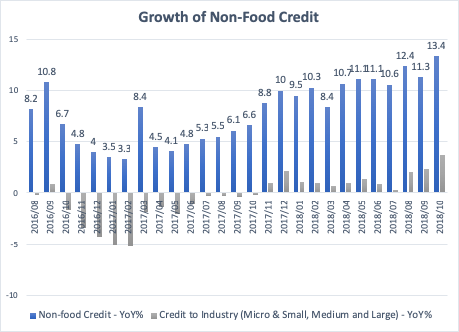
The following image shows the broad breakdown of NFBC and its recent percentage share as per credit quantum.

Credit to Agriculture & Allied Activities

Agriculture and allied activities constitute the single largest contributor to the Gross Domestic Product (GDP), accounting for almost 33% of the total. They are vital to the national well-being, providing the basic needs of the society and the raw materials for some of the important segments of Indian industry. They also provide livelihood for almost two thirds of the workforce.

Over the last four decades, agriculture has made important strides in our country, and the importance of credit has grown multifold. At Rs. 10.6 lakh crores, the credit to this sector has grown at 8% since Oct ‘17.

Credit to Industry

Credit to Industry comprises of the major chunk (~34%) of Non Food Bank Credit and is pegged at Rs. ~27 lakh crores, growing at a paltry rate of 3.7% annually this Oct ‘17. Credit to the industry has been slowing down since Sept ‘16, contracting by 1.7% for the first time in Oct ‘16. The fall can be partly attributed to the twin-balance sheet problem (highly indebted companies and banking system plagued with rising NPAs) and partly due to a slowdown in credit demand post demonetization.

The credit can be subdivided as per business size as shown in the image below.

It can also be divided on the industry the credit is allocated, as shown in the table below.

Industry% Share of credit to industry% Share of new credit to industry (Oct ’17-18)
Infrastructure35%73%
Basic Metal & Metal Product14%-38%
Textiles7%3%
Other Industries7%-3%
Chemicals & Chemical Products6%17%
All Engineering6%7%
Food Processing5%6%
Construction3%8%
Vehicles, Vehicle Parts & Transport Equipment3%8%
Gems & Jewellery3%0%
Cement & Cement Products2%-2%
Petroleum, Coal Products & Nuclear Fuels2%4%
Rubber, Plastic & their Products2%4%
Mining & Quarrying (incl. Coal)2%11%
Paper & Paper Products1%-1%
Beverage & Tobacco1%-2%
Wood & Wood Products0%1%
Leather & Leather Products0%0%
Glass & Glassware0%2%

The above table also shows the industries where the new credit allocation in ‘17 -’18 is accelerated as compared to its credit share in ‘18.  

As seen above, credit to major sub-sectors such as infrastructure, chemicals and food processing accelerated in Oct’18, while the credit to cement and products as well as to basic metals saw a contraction. With the non-banking financial companies (NBFCs), a major source of financing for MSMEs, denting the sector with stressed loans, the increase in the flow of funds to industry can be viewed as a relief for Micro, small and medium enterprises (MSMEs).

Also, the proposed loan restructuring mechanism by RBI with loans upto Rs. 25 crore for MSMEs will be a positive for this sector. The initiative by Modi government to introduce a portal for sanctioning loans to an MSME’s within 59 minutes may seem like a good initiative, but the availability of credit from formal sources has remained a problem for the sector.

Credit to Services

Credit to Services sector accounts to 28% in Oct ‘18, but hogged the lion’s share (~50%) of the new loans in Oct ‘17 – Oct ‘18. The quantum is fueled by major credit increase to NBFCs. Banks are increasingly using NBFCs to do their lending for them. The increase in credit has come at a time when NBFCs are finding it difficult to secure short term funding from the money markets and are increasingly looking up to banks for their liabilities. Total bank credit to NBFCs soared by over Rs 2 lakh crore to Rs 5.62 lakh crore as of Oct ‘18 from Rs 3.61 lakh crore in the same period of last year. This is the largest credit growth witnessed by any of the sector in the economy during the last 12 months.

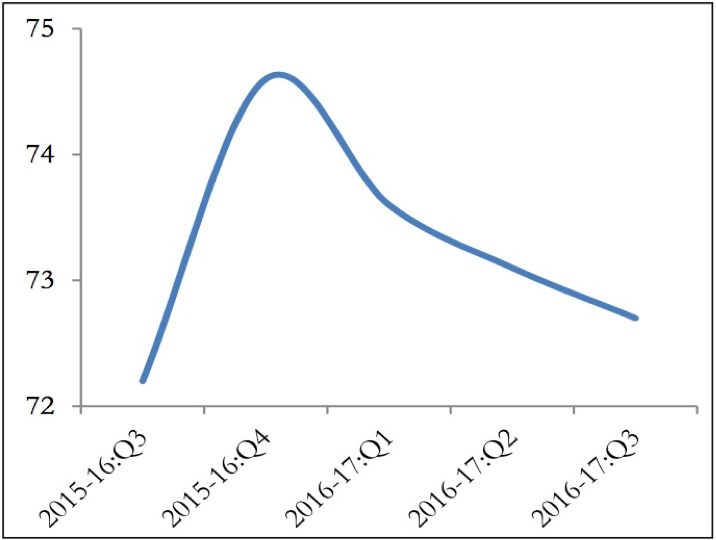
The following chart shows the increasing credit share % of Gross Bank Credit to NBFC.

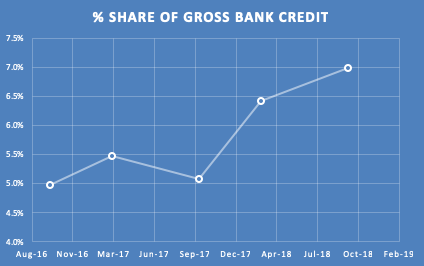
However, bank credit to NBFCs slowed down to 13.3 per cent during the April to October period of 2018. When the IL&FS payment crisis hit the financial sector in August, bank credit to NBFCs slowed down considerably, leading to a liquidity squeeze. Banks significantly reduced their funding to NBFCs, virtually closing a major resource funnel for NBFCs and housing finance companies. The fundamental issue, however, is an asset-liability mismatch in the operations of NBFCs like IL&FS. To explain in short as an example, these firms borrow funds — say for three or five years — from the market and lend for longer tenures — 10 to 15 years. In a rising interest rate scenario, this contracts the margin considerably and sourcing of funds becomes tough, thus hurting the NBFCs.

Credit to Personal Loans

At about Rs. 20.4 lakh crores, credit to personal loans has sustained a growth of 16% y-o-y as of Oct ‘18. Housing loans, contributing to more than 50% of personal loans, has seen its segment grow at 17.6% since last year.

Major reasons supporting its growth are:

  1. With high NPAs in other sectors, banks find it easier to give home loans with low margins and low defaults
  2. Growing affordability for the first-time home buyers, supported by government incentives like the PM’s Awas Yojana has resulted in a rise in primary home purchases, especially in the affordable housing segment.

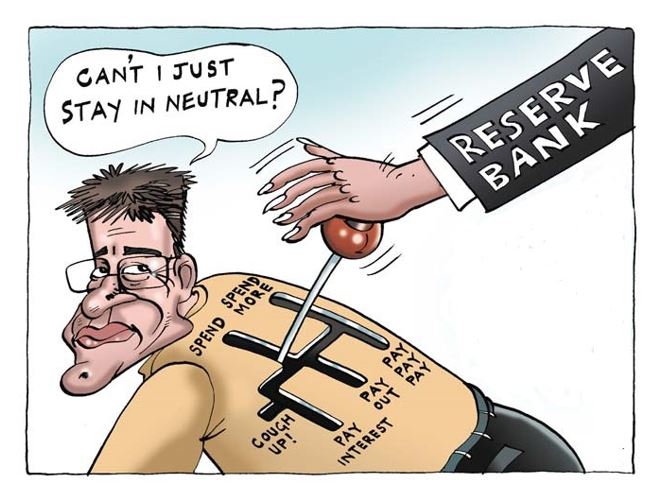
Government and the RBI

The Government and RBI has been at odds over the past few months. While the RBI has asserted that the bank lending is growing at a brisk pace, the government and the industry lobbies insist that the credit taps have remained shut. The data does back the fact that even when all sectors have seen an inflow of credit, few of the sectors took the major share of the loans during the year.

For instance, for every ₹100 of new bank loans added, it was services which bagged ₹50, while industry received just ₹10. Out of the ₹10 advanced to industry, large firms gobbled ₹8.30, while medium and small enterprises were left with just ₹1.70. As much as ₹31 out of every ₹100 of new bank loans did not go to businesses at all, but to retail folk borrowing towards their home, credit card or personal loans.

Although the credit flow to services appeared plentiful, NBFCs (financial services) cornered a disproportionate share of loans to this sector. With as much as ₹21 of every ₹50 in new bank loans to services went into NBFCs, direct borrowers in services were left with smaller slices of the loan pie. NBFCs in turn seem to have funnelled this money into consumer loans, real estate, affordable housing, loans against property and shares, promoter funding and infrastructure.

There has been concern about a squeeze on bank credit to MSMEs post-demonetisation. Overall loans to MSMEs doubled this year, with ₹11.6 out of every ₹100 in new bank credit flowing to them. But the MSMEs in services hogged ₹11 of this, leaving manufacturing MSMEs with just ₹0.60. The surge in services MSME loans likely reflects small-ticket loans to entrepreneurs under the Pradhan Mantri Mudra Yojana, which has seen a big push by the government.

Within the priority sector, though services MSMEs, agriculture and housing saw brisk growth, exporters were starved of credit, with their credit flow in negative territory for the last three years. Agriculture, bagging ₹8 of every ₹100 in bank loans has also seen a dip in credit flow compared to the pre-demonetisation period.

At this station, it is important for the Centre and the RBI to let banks to make their own decisions on allocating credit, instead of funneling it to specific segments. For banks to regain their appetite to lend to riskier borrowers, they must first digest the mountain of bad loans that today account for over 11% of their loan books.

References:

  1. https://economictimes.indiatimes.com/markets/stocks/news/learn-with-etmarkets-how-does-food-credit-work/articleshow/51888321.cms
  2. https://rbi.org.in/Scripts/Data_Sectoral_Deployment.aspx
  3. https://www.indiamacroadvisors.com/page/category/economic-indicators/money-and-banking/bank-credit-nonfood/
  4. https://indianexpress.com/article/business/banking-and-finance/reserve-bank-of-india-credit-nbfc-5473509/
  5. https://www.thehindu.com/business/bank-credit-is-it-growing-and-wheres-it-going/article25758721.ece
  6. https://indianexpress.com/article/business/banking-and-finance/reserve-bank-of-india-credit-nbfc-5473509/
  7. https://www.livemint.com/Opinion/KbpiYyFXCs1Y99lEydzrCL/The-tale-told-by-the-bank-loan-numbers.html

Disclaimer – All the views expressed are opinions of Networth – IIMB Finance Club – members. Networth declines any responsibility for eventual losses you may incur implementing all or part of the ideas contained on this website.

Distressed Asset investments and IBC Process in India – Part 2

Blog by: Ayush Agrawal (PGP 2016-18)

As we discussed in part one, a loan becomes Non-Performing Loan (NPA) when any form of repayment (principal or interest) is due for more than 90 days. Based on the number of days past due date, the RBI guidelines mandate banks to classify them as sub-standard assets, doubtful assets or loss assets with different provisioning norms. Moreover, any non-performing loan can trigger IBC (Insolvency & Bankruptcy Code, 2016) proceedings against the debtor (the company that has taken the loan) by filing a case in NCLT (National Company Law Tribunal).

NCLT is the adjudicating body for all disputes related to companies. Cases filed under IBC also come under the gamut of NCLT. However, NCLT is not the only adjudicating body in the IBC process, and we will allude to other bodies involved later. As per IBC, the case against a debtor can be filed by several entities which are listed below:

  1. Financial Creditors: A financial creditor is someone to whom a financial debt is owed. Financial debt refers to interest-bearing debt including any type of term loan, bond or debenture issued by the company etc.
  2. Operational Creditors: An operational creditor is someone to whom an operational debt is owed. Operational debt refers to claims in respect of provisions for goods or services including dues payable to Central Government or State Government.
  3. Corporate Applicant: The corporate debtor himself can also file a case in NCLT for insolvency/bankruptcy.

Once the case has been filed by either of these three entities, NCLT needs to identify whether a default has occurred within a period of 14 days (extendable up to 21 days) based on the corresponding documents provided by the applicant and admit the case. If a financial creditor has filed the case, it needs to recommend the appointment of an Interim Resolution Professional (IRP) – which is not necessary if an operational creditor/corporate applicant has filed the case. An IRP is a certified professional (check link for details) who is responsible for running the Corporate Insolvency Resolution Process (CIRP) once the case has been admitted.

Let us look at how does the CIRP process works. After the case has been admitted into NCLT, a moratorium prohibiting continuation of existing suits/filing of any further suits on the company (corporate debtor) is declared by the IRP. The IRP simultaneously issues a public notice calling for claims on the company by financial and operational creditors (All financial creditors need to file claims within the stipulated period if they wish to be part of the CoC). The claims are admitted by the IRP after a careful analysis of supporting documents provided by creditors. Based on the admitted claims, a Committee of Creditors (CoC) is formed where only financial creditors have representation with a voting share in proportion to the financial debt owed to them. (Note: It is not necessary for operational creditors to file their claims within the deadline) The CoC then appoints the Resolution Professional (RP) which can be the same as the IRP or a replacement.

The RP is responsible for conducting the CIRP process further. The RP prepares an Information Memorandum (IM) which includes all relevant information about the debtor that may be required for formulating a resolution plan. A resolution plan details how the company would be restructured so that it operates as a going concern in future and is able to generate sufficient cash flows to service the debt. The RP calls for Expression of Interest (EoI) for submission of resolution plans. Resolution applicants are mostly strategic buyers who are either industry leaders or conglomerate houses that have the ability and willingness to cure the corporate debtor in default. The resolution applicants perform their own analysis of the company (corporate debtor) based on the IM provided, amongst other sources, and determine if there exists value in the company as a going concern. Based on the analysis, they submit resolution plans to the RP which are opened in a CoC meeting. The CoC is required to vote on each resolution plan. The voting generally happens of the basis of which plan will yield highest recovery to financial creditors. A minimum of 66% CoC voting share is required for any resolution plan to get accepted in CoC. Once a resolution plan is accepted by the CoC, it is binding on the corporate debtor and its employees. The IBC also mentions that in such a case, the dissenting financial creditors (those who did not vote in favour of the resolution plan) and all operational creditors will be paid at least the liquidation value (the concept of liquidation value is discussed below) in priority to the assenting financial creditors.

pic

Figure 1: CIRP Process

The entire CIRP process needs to be completed within 180 days, extendable to 270 days. If the CoC and RP fail to accept any resolution plan within this time frame, the company goes into liquidation. For determining the liquidation value of the company, the RP appoints three liquidation professionals to independently determine the liquidation value of the company. An average of the two closest liquidation values is taken as the liquidation value of the company by the RP. For Eg. If the valuations by three liquidators come out to be INR 3000 Cr, INR 3300 Cr and INR 3350 Cr, then the liquidation value as taken by the IRP would be equal to INR 3325 Cr.

If the company goes into liquidation, the recovery to all creditors (financial and operational) as well the workmen and employees is based on the liquidation waterfall that has been defined in IBC. As per the liquidation waterfall, the distribution of liquidation value is to be done in the following order:

  1. CIRP costs (costs incurred during the CIRP process including RP fees) and liquidation cost
  2. Workmen dues for the period of last 24 months preceding liquidation process commencement date and secured creditor dues given that the secured creditor has relinquished the charge on his security. This essentially means that the creditor would no longer have a lien on the asset which was kept as security against the loan.
  3. Employee dues for the period of 12 months preceding liquidation process commencement date
  4. Debt owed to unsecured creditors
  5. Central government/State government dues
  6. Preference shareholder
  7. Common equity holders

Now that we are clear on how the IBC process works, let us look at the other bodies apart from NCLT which help in the adjudication of the process. National Company Law Appellate Tribunal (NCLAT) and Supreme Court (SC) are two adjudicating bodies which seek to address the grievances of any entity associated with the CIRP process. If any participant in the process feels that injustice is being done based on the IBC law, then he/she can approach NCLAT and ultimately the Supreme Court to seek justice. As soon as any entity approaches either NCLAT or SC for grievance redressal, the NCLT process automatically comes to stay.

Post the release of the first draft of IBC there have been several amendments in a short span of time. This has kept both foreign and domestic investors guessing, and several are now shaky about investing in distressed assets in India. Some of the major amendments made in IBC along with their implications are:

  1. Home buyers as financial creditors: The home buyers did not have any say in CoC based on the original code. However, Jaypee Infratech is a case in point (2017) which highlights the importance of including home buyers as financial creditors in case of real estate debtors. Since the real estate projects are financed by home buyer money, they are the rightful financial creditors in the IBC process. (Some people say that including home buyers as financial creditors has negative implications. The jury is still out, and interested people might want to read up on it)
  2. Exclusion of related parties from submitting a resolution plan: This has thus far been the most significant amendment in IBC. Listed under section 29A, this amendment prohibits any party related to the existing promoter in any way as well as any party which had defaulted on any of its related party (associates/subsidiaries) debt at the time the corporate debtor in question went into NCLT, to participate in the CIRP process as a resolution applicant. The objective of this section was to prevent malicious attempts to acquire the company and give it back to the original promoters. However, the fine prints in this section are so stringent that they make almost every big conglomerate house in India ineligible to participate in the resolution process. (Interested people can read about the case in point of Essar Steel)
  3. The omission of dissenting financial creditors from IBC: The latest amendment which came about last week has excluded the concept of dissenting financial creditor. This means that, while earlier dissenting financial creditors were paid liquidation value in priority to the assenting financial creditors, now they will no longer enjoy such a privilege and the accepted resolution plan will be binding on all financial creditors. This is a progressive step in a way that it encourages financial creditors to accept reasonable resolution plans even though the recovery might be lesser than the liquidation value.

We hope that students who have read the first two parts of this blog post are now comfortable with what the IBC as a law and CIRP process is all about (the fact that you guys made it past IBC and CIRP abbreviations in this sentence suggests that we have been successful in our attempt). Today, the entire country is reeling under the weight of distressed assets, and there is a lot of pressure on the government to resolve them. As per our prediction, there is still a lot of contagion effect which has not yet been realised and hence the exciting times in distressed asset investing are here to stay. Not only does it open several new opportunities in the world of finance, but it also gives one the satisfaction that the malaise which the country was going through is finally being cured (trying to find the philosophical us somewhere behind the opportunistic capitalist).

Disclaimer – All the views expressed are opinions of Networth – IIMB Finance Club – members. Networth declines any responsibility for eventual losses you may incur implementing all or part of the ideas contained on this website.

Distressed Asset investments and IBC Process in India: Part 1

Blog by: Vignesh Meyyappan (PGP 2017-19)

Have you come across the recent sale of companies like Monnet Ispat and Bushan Steel and felt lost about the complex terms and valuation principles behind these deals? Wondering why the home buyers in Jaiprakash Associates were creating a hullabaloo? Is there truth in the accusations of politicians that rich businessmen with large loans are “getting away” with pulling a fast one on the public? We will attempt to answer these questions in this 4-part series about Distressed Asset investments and IBC Process in India. Welcome, to the world of distressed asset investing (or) as railed in popular media, “Vulture Funds”.

The market need for stressed asset resolution:

For financial valuation, one of the key assumptions that are made is that the firm is a “Going Concern”, that is the firm is expected to continue operations for an indefinite period. This need not be applicable in situations where the health of the company has deteriorated to such an extent that it is in the best interests of stakeholders to give the firm a decent burial. In financial terms, this event is called “Liquidation”, where the company ceases operations and distributes the assets of the firm to the equity holders after paying all its obligations.

However, when liquidation occurs, the value of the firm’s assets reduces significantly (sometimes to a fraction of the true value of the asset). Hence, liquidation is not a beneficial outcome for the stakeholders because the value of the firm becomes depressed thereby leading to lower realisations, or in financial speak, “recoveries”.

The other possible scenario for the firm is to engage the stakeholders in a discussion that will allow the firm to restructure its loans and make them viable (in terms of payments) to better prepare itself to face the weaker operating scenario. This is beneficial for the firm because it allows continued operations, save hundreds or possibly thousands of jobs etc. For the lenders, the cash flows generated by a going concern will lead to better recoveries of the amount lent. For equity holders, there is a possibility to hold equity in the restructured firm, hence preventing a complete loss of capital.

(Financial Accounting 101: Equity is the residual claim on the assets of the company. Meaning, in the event of liquidation there is a very high chance of equity holders getting nothing from the firm – a complete loss of capital. Stressed asset resolution prevents this from happening, albeit only to a certain extent)

We have so far established that the resolution process is a much better option for financial stakeholders than liquidation. Now let us look at the evolution of this specific market in India.

Note: The words restructuring and resolution have been used interchangeably in this blog. They have slightly different meanings, but that can be ignored for now.

Evolution of the stressed asset landscape in India:

The normal principle for restructuring is that a firm (an “account”, for the lender) should be downgraded in the event of default in payments on loans/bonds.

Over the years, India has had a complex web of regulations governing the procedures that need to be undertaken by lenders to pursue resolution of stressed assets. The laws in place included SARFAESI Act, Sick Industrial Companies Act, The Provincial Insolvency Act, Companies Act, and Recovery of debts due to banks and financial Institutions Act, The Provincial Insolvency Act etc. Also, the overlapped jurisdiction of different authorities like High Court, NCLT (National Company Law Tribunal), Debt Recovery Tribunal slowed down the debt recovery process.

The first signs of change came in when, the RBI introduced, in August 2001, the Corporate Debt Restructuring (CDR) Mechanism for a restructuring of debt. This regulation removed the need for an asset quality downgrade if the restructuring plan met certain conditions. The CDR mechanism worked well initially. In later years, the provision was used more as an asset quality downgrade avoidance mechanism than for effective resolution. Therefore, in May 2013, RBI announced the decision to withdraw the temporary restraint on asset classification effective April 1, 2015. However, in the wake of the mounting NPAs, the Reserve Bank allowed asset classification benefits for certain types of restructuring schemes. These included the Strategic Debt Restructuring (SDR), Flexible Structuring of Project Loans and the Scheme for Sustainable Structuring of Stressed Assets (S4A). Thus, while the principle that a restructuring would call for downgrade of the asset was in place, a window of exception was opened, provided the restructuring met certain conditions. The focal points of the schemes were the deep restructuring of stressed assets, change of ownership/management of stressed borrowers, optimal structuring of credit facilities, and haircuts (the discount at which the loan is sold) on loans wherever the exposures were economically unviable.

The multitude of schemes, though well-intentioned had certain unforeseen consequences:

  • Instead of restructuring the firm to lead it to better financial health, the general approach of bankers to stress in large assets was one of avoiding the de jure recognition of non-performance of such accounts. This is one of the main reasons for having a history of many cases of failed restructuring as the schemes were used for avoiding a downgrade rather than resolving the asset.

Prolonging the true asset quality recognition suited both the bankers and the borrowers. The former could make their books look cleaner than they were; the latter could avoid the defaulter tag even while, they were in fact defaulting. This was referred to by the RBI Governor as the banker-borrower nexus.

  • These schemes rarely led to a change of management at the companies that were undergoing the restructuring process.
  • The mechanisms focussed more on the procedural correctness than a time-bound resolution, thus aiding (i)

To overcome, the drawbacks of the previous legal frameworks, the Insolvency and Bankruptcy Code (IBC) was enacted in 2016. The law provided for both a process and time-oriented approach to stressed asset resolution. We will dive deep into the IBC in part 2 of this series.

What makes an asset an NPA?

In the event of default of payment by a firm, the lenders need to classify the asset under the following categories of Special Mention Accounts (SMAs):

SMA Sub-categories Basis for classification – Principal or interest payment or any other amount wholly or partly overdue between
SMA-0 1-30 days
SMA-1 31-60 days
SMA-2 61-90 days

At the end of 90 days, if the firm continues to be in default, the lender is mandated to classify the account as a Non-Performing Asset (NPA). Post this period, the lenders have 90 days to come up with a restructuring plan, extendable by a further 90 days.

The main idea is to introduce a time limit and create a sense of urgency for both lenders and borrowers in resolving the default to prevent the initiation of bankruptcy proceedings.

Disclaimer – All the views expressed are opinions of Networth – IIMB Finance Club – members. Networth declines any responsibility for eventual losses you may incur implementing all or part of the ideas contained in this website.

References: The authors are thankful in no small part to RBI research reports, press releases and speeches by RBI officials at various events

Image Credits: kenteegardin on Visual hunt / CC BY-SA

Trade wars: Exploring a global phenomenon

Blog by: Shashwat Gupta, Himani Sheth, Venkat Samala, Onkar Habbu

Trade plays an important role in the growth of the world economy. This is evident from Figure 1 which shows that global trade in goods and services grew at an average real rate of 6% a year from the 1960s to the 2007 global financial crisis, twice as much compared to the 3% annual real GDP growth during the same period.

fig 1

Figure 1. Real Trade and Real GDP, 1960 – 2016

However, with a slowdown in the pace of trade reforms and the rise of protectionism, the role of trade is at a critical juncture. In such a scenario, one of the conflicts which can severely impact the world economy is a trade war.

So what exactly is a trade war?

Trade war, as the name suggests is an economic war between nations. It results from countries’ extreme protectionist stance wherein countries impose tariff and quota restrictions and other trade barriers to damage each other’s trade; thereby offsetting their imports.

But who does it help then?

A trade war may commence if one country perceives another country’s trading practices to be unfair. Protectionist measures are used to protect domestic industries and to increase employment. Increasing the tariff on other countries’ goods and services reduces their competitiveness which gives a boost to domestic production. Domestic trade unions and lobbyists also pressure politicians to make imported goods less attractive to consumers. In addition to raising revenue for the government, it also helps in guarding new or key industries against free trade. A reduction in the quantity of and total spending on imports may also improve a nation’s trade balance. However, one of the repercussions of these measures can be the action taken by another country. It can retaliate against tariffs using tit for tat strategy and in such scenario, benefits from tariffs are more difficult to be estimated.

These benefits from protectionism are contrasted with its costs. Tariffs result in inefficient resource allocation in long run. The producers which are protected do not face international competition and don’t have the incentive to innovate and reduce costs. Domestic products lose their competitive advantage in the world market and exports of the country suffer in long run. Tariffs also increase prices in the domestic market and have an adverse impact on consumers. Distortion in price signals may result in directing investment in inefficient industries.

And the economics behind it.

Economically, tariffs result in an overall welfare loss for the country. Considering Demand and supply curve as given in Fig 2, losses and gains from imposing a tariff on imports can be identified.

fig 2.png

Figure 2. Pictorial view understanding net welfare loss

Losses:

  • Domestic consumers have to pay higher prices (P2 compared to P1). This also results in a reduction of demand from Q4 to Q3 This results in lost consumer surplus of the indicated area (1+2+3+4)
  • Foreign Exporting firms’ exports reduce from (Q4 – Q1) to (Q3 – Q2).
  • Demand for other firms in the economy reduces. This is because consumers have less real purchasing power as prices increase due to tariffs.

Gains:

  • The government collects revenue of area 3
  • Domestic Producers who are able to sell higher quantity (Q2 instead of Q1) at a higher price. Producer surplus increases by area 1

From the above losses and gains, it can be identified that the loss in the country’s welfare is due to the imposition of a tariff is the indicated area (2+4).

In addition, protectionist measures tend to be met with some forms of retaliation. Protection against imports is accompanied by a fall in exports for the country. These measures also have a downward multiplier effect for the world economy. When a country protects itself against imports, exports of other nations fall which affects their aggregate demand. Fall in aggregate demand and national output results in the reduction of their imports as imports are a function of national income. This process when continues results in a downward spiral of reduced trade and world output.

Is it something new?

Trade has been the reason for the rise and fall of empires, civilisations and countries since ages. Trade blockade was used as a weapon by Napoleon to paralyse Great Britain through the destruction of British commerce in Napoleonic wars. The system hurt English industries but also damaged regions of France dependent on overseas commerce. The need for trade resulted in evasions of blockade as well as large-scale smuggling, and French allies themselves ignored the trade blockade. Regulation of trade in colonies, navigation acts and mercantilist policy of Britain sowed the seeds of the American revolution. In India too, the East India company used tariff structure to promote import of raw material from India and export finished goods from Britain to India.

The most glaring example of how protectionist policies can lead to a significant downturn in the global economy comes from Great Depression years of the 1930s. As the global economy entered the first stages of the Great Depression in 1929, the tariff act of 1930, also known as Smoot-Hawley Tariff implemented protectionist trade policies to protect American jobs and farmers from foreign competition. Threats of retaliation by other countries were swift and foreign governments increased rates against American products. The result was more prolonged and exacerbated Great Depression. Figure 3 shows the adverse impact of the act on US securities.

fig 3

Figure 3. Impact of 1930 Smoot-Hawley Tariff Act on US equities

The present:

With all the recent hostilities, it’s easy to forget that China and the United States have been top trading partners for years.

In 2015, China overtook Canada as the United States’ largest trading partner, boasting nearly $500 billion in total imports and exports, about 15 per cent of total U.S. trade. The United States, on the other hand, has been China’s top trading partner since the 1990s, overtaking Hong Kong as the largest importer of Chinese merchandise goods in 1998.

fig 4-1

fig 4-2.png

Figure 4. China US trade relationship

In early 2018, the US under the presidency of Donald Trump introduced the first set of tariffs on the import of solar panels and washing machines. The decision was not well received by China since it accounted for the major part of those import. Within months of threatening to do so, US raised the import taxes on steel and aluminium, majorly importing from EU and China, exempting its NAFTA partners among few others.

Donald Trump, under his campaign promise of ‘America First’, has been very clear of his discomfort with the increasing US trade deficit, with China holding the lion’s share of it. He had vowed to cancel many international trade deals, targeting China for its ‘unfair trade practices over the years’. Trump justified the tariffs on the grounds of protecting homegrown industries and generating jobs for the Americans.

These tariffs were not just limited to China and the EU, but could likely affect with India, South Korea and other nations, a move slowly secluding the US into its cocoon.

The retaliation

As expected with the escalating tariffs, China wouldn’t just be sitting ducks. When Washington imposed the first round of 25 per cent tariffs on $34 billion of Chinese goods, China quickly issued tariffs on an equivalent billion dollars in US exports, disproportionately affecting US farmers. Even the EU retaliated with tariffs on almost $3.2 billion worth of US imports, including whiskey, tobacco and Harley Davidson, just to give a strong message to Trump. This round of tariff was surrounded by waves of tit-for-tat trade attack proposals, targeting China’s ‘Made in China 2025’ plan, to US agricultural industry, to just knee-jerk reactions. An updated timeline of the battle is in the figure below

fig 5

Figure 5. How the tariff battle escalated this year

Impact on countries

Does it make America great again?

As can be seen from the below infographic, the first impression comes of the strong stance of US in this trade war. But the impact is not all so rosy. US farmers can be significantly affected because of the retaliatory measures put extensively on agricultural and dairy produce. So can the aircraft and automobile industry due to adverse effects of exports of these sectors to other nations. While the domestic industry might thrive under protectionism, consumers of the goods could face higher prices with a lesser choice. Some companies have also moved their production out of US to have a better international export market. All of these might hurt the employment rate, prices and consumers at the very end.

fig 6

Figure 6. Goods covered by proposed tariffs

How is China holding up?

With proposed tariffs on Chinese exports to the US worth more than $500 billion, it is going to pinch many vital Chinese industries.

The impact of the Washington-Beijing trade skirmish will be relatively muted on the Chinese economy, noting that exports to the U.S. do not hold a commanding presence in China’s economic portfolio. But having said that, the trade war with the U.S. couldn’t have come at a worse timing for China, which had just begun focusing “in earnest” on fixing problems with its economy.

China’s banks had extended a record 12.65 trillion yuan ($1.88 trillion) in loans in 2016 as the government encouraged credit-fueled stimulus to meet its economic growth target. The credit explosion stoked worries about financial risks from a rapid build-up in debt, which authorities in 2017 pledged to contain. Both China’s monetary and fiscal policies have been kept on a tight leash so far this year and deleveraging — the process of reducing debt — has been hastened through tighter regulations. After years of hand-wringing and navel-gazing, China had finally begun to focus in earnest on curbing credit growth, until this moment of the ongoing trade war.

Analysts have suggested that under the circumstances, easing monetary conditions to support demand and allowing the currency to absorb the shock of the trade war are the right policy choices. The depreciation of the yuan would offset the loss in export competitiveness for Chinese exporters due to higher tariffs, meaning that Chinese goods will essentially be cheaper to Americans.

But this comes as a juxtaposition – Beijing is seeking to implement a relatively tight monetary policy to force financial deleveraging, but it also needs easier monetary conditions to support growth.

Given the limits of using monetary policy, fiscal measures to support exporters or boost domestic demand could also be used. That could include increasing tax rebates — known as the value-added tax credit rate — to exporters in China which would raise their income by between 3.5 per cent and 4 per cent.

Is it impacting India?

When a trade war happens, it just doesn’t affect the two economies involved but all the economies open to world trade. It comes as no surprise here that India is getting dragged into this. The basic principles of economics, i.e., demand and supply, will once again come into play. The shortage of supply of a good, either finished material or raw material, will increase the final consumption price for the consumer. Moreover, the burden of increased tax from the duties will also be borne by the final user.

Impact on rupee – Since August 2018, the value of rupee has been continuously falling to new lows against the dollar, which coincided with Trump’s threat of imposing a new round of tariffs on exports worth $200 billion. This is one of out of the slew of reasons that led to USD appreciation; the burden on India’s trade deficit is steadily increasing owing to the manifold impact of depreciating rupee and rising oil prices in rupees.

Impact on the stock market –  With a cautious approach of the investors, the key indices in the Indian share market took a dip amid global concerns with the threat announcements, but they have since then regained their bullish growth.

Impact on trade deficit with the US – As the United States of America imposed duties on steel and aluminium, India now has to pay approximately $241 million worth of tax to the US. India, on the other hand, as a countermeasure has proposed imposing duties on 30 different types of goods. This will ensure that the US has to pay about $238 million as duties to India. However, this will make life more difficult for the end consumers as everything that falls under the tariff scanner is expected to become more expensive.

Impact on industries: The additional duty imposed could have a detrimental effect on the manufacturing industry, as the cost of production will go up due to the rise in the price of raw materials. Moreover, other things which may face an increase in price include foreign motorbikes with high engine capacity and food products like almonds, walnuts, pulses, etc.

US embargo on Iran: On May 8, US government decided to pull out of Iran Nuclear deal and threatened to impose economic sanctions on countries that continue to trade with Iran. Given that Iran was the fourth largest oil exporter (12% of the country’s imports in 2017-18) to India, the following factors may adversely affect India:

  1. Iran offers crude oil at better terms (Longer credit period, freight discount) to India. Negotiating new terms with other countries could make crude costlier for India.
  2. As the sanctions kick in, the oil production from Iran will dry up, leading to lower crude oil output, which could eventually push the crude prices up if OPEC members do not increase their production to the extent of the shortfall.
  3. Iran accepts part payment for the oil purchases in rupees (other import partners are paid in USD). This, in turn, helps in reducing the USD demand and keeping INR stronger.

Key indicators to assess the impact of the trade war:

There are few economists who are dismissive about these retaliations by claiming the US-China threats are more bark than bite. Keeping a check on the following indicators could be a good way to assess the damage done by the trade war:

  1. IFO – Germany as the largest European economy and one of the largest exporters, would be particularly exposed to any trade slowdown. The Germany-based IFO Economic Research Institute produces leading confidence indicators for the Euro area and Germany.
  2. South Korea and Taiwan Export numbers:

As one of the largest intermediate goods exporters for goods manufactured in China and the US, the impact of a trade war would definitely be first visible in the export figures of these countries.

  1. New export orders:

New export component from the JP Morgan Global Manufacturing purchasing managers index could give a fuller picture of the demand visibility.

  1. Purchasing Managers’ Index (PMI) of Asia and Europe:

The trade war threats have a negative bearing on the manufacturers’ sentiment as reflected by the PMI.

  1. China trade data:

Economists often cite China’s trade data to be representative of global demand. An index following China’s export orders/trade volume could help in deciphering the impact of the trade war.

The global economy and deglobalisation?

After World War II, America has written and dominated the rules of global business and international relations. Many of the major world organisations, like the UN, WTO, World Bank, IMF, G7, NATO as well as regional ones – the EU and NAFTA, were functioning under American dominance and majorly for her interest.

Under the Trump era, the US Establishment launched the process of “deglobalization.” Under the slogan “America First,” the president has withdrawn support from the Paris climate accord, the TPP, the Iran nuclear deal and UNESCO. It threatens to leave the UN and even NATO. Washington has violated multilateral agreements and international treaties and has tried to impose new rules on its partners. Dissatisfied with the American domination in world trade, the nations have started to come together to coordinate their views and activities, with the beginning of the 21st century seeing several new regional and international organisations being formed.

The way forward:

Regional trade agreements provide more favourable market access conditions to signatories and thus facilitate trade by reducing barriers across parties. Partners agreeing on common standards and deriving benefits from mutually enhanced trade can form trade agreement among them. This is in contrast with WTO procedure which works on the principle of consensus and requires the approval of all members.

It has been emphasised by WTO members that Regional Trade Agreements must remain complementary to, and not a substitute for a multilateral trading system. WTO Director-General Roberto Azevedo has said that “many key issues – such as trade facilitation, services liberalisation, and farming and fisheries subsidies- can only be tackled broadly and efficiently when everyone has a seat at negotiating table.”  Multilateral trade agreements also provide an opportunity to all nations keep their views over trade matters and policies which helps in integration of developing and least developed countries in the world economy. This is essential because of the today’s interconnected world where actions of one nation affect not only the involved parties but other nations as well.

Beggar-thy-neighbour policies which entail the use of increased tariffs, import quotas and restrictions only propagate trade wars. These are detrimental not only to participating nations but to the whole world economy due to reduced demand and investor confidence. Multiple regional trade agreements, WTO, IMF and other measures to ensure free and fair trade play their part to reduce the probability of trade wars and their impact should they ensue. Cooperation of all nations in multilateral platforms such as WTO is necessary to make the best use of gains from trade and share the benefits across all parties.


Disclaimer – All the views expressed are opinions of Networth – IIMB Finance Club – members. Networth declines any responsibility for eventual losses you may incur implementing all or part of the ideas contained in this website.

Sources:

https://www.bbc.com/news/world-43512098

http://www.visualcapitalist.com/history-u-s-trade-wars/

https://economictimes.indiatimes.com/markets/stocks/news/economists-are-watching-these-indicators-to-gauge-trade-war-pain/articleshow/64751691.cms

https://www.thehindubusinessline.com/economy/macro-economy/india-to-us-sanctions-against-iran-oil-imports-will-have-a-ripple-effect-on-energy-value-chain/article24555853.ece

Uncovering Currency Movements (Part 1)

Blog by: Ayush Agrawal & Rishi Vora

8


Have you ever wondered what makes currencies tick? Why is it that most people find FX pairs the most difficult asset class to understand? Is it one among the macroeconomic fundamentals, interest rate parities, carry trades, technicals, risk off scenarios that dominate FX trading or is it a mix of all these factors which ultimately transpires into pips movement. Most people (even prudent investors) believe that FX movements are random. In this blog, we try and unfold the theory that lies behind currency pair movements by analyzing EURUSD in the long term (1 year).

As can be seen from the Fig 1 below, EURUSD has appreciated over the last one year.

1

US Macroeconomic Overview

The US economy has been doing well since 2013 which prompted fed to go for tapering of its bond-buying program (Quantitative Easing) in December’13 thereby decreasing the supply of USD and resulting in a stronger dollar. Macroeconomic data points in the last one year (see figures below) have clearly shown strong US economic fundamentals.

2

As can be seen from Fig 2, the non-farm payroll numbers which indicate new non-farm jobs created in the US have been a steady month over a month except for a temporary shock in September’17 when the US was hit by Harvey hurricane. This has been supported by a steady fall in the unemployment rate which is now at an all-time low of 4.1% post-2008 financial crisis. In fact, economists believe that the slack in labor market has been constantly narrowing over the last one year and that it is expected to reach full employment soon.

The US fed in its monetary policy follows inflation targeting which mandates it to maintain CPI at 2%. The CPI numbers in Fig 3 indicate that inflation has been on the higher side in the US mostly due to high consumer demand. This coupled with steady earnings growth again point to a strong economic recovery in the US. Moreover, the expectations of a reduction in corporate tax rate have further driven equities, pushed inflation higher and have resulted in anticipation of a stronger economy in the long run.

If we go by the fundamentals of macroeconomics, a stronger US economy supported by expectations (32.8% probability) of two rate hikes in 2017 (Fig 4) should lead to capital inflows and hence USD appreciation. However clearly, this is not the case. Why? In order to understand this, we would need to look at what was happening in Eurozone meanwhile.

3

Eurozone Macroeconomic Overview

The European Central Bank (ECB) carried out quantitative easing much later than the Federal Reserve. As a result, the economic recovery in Eurozone started late than that in the US. However in the last one year, from Germany’s macroeconomic data, we can see that QE in Eurozone has yielded good results and hence has resulted in the recovery we are witnessing today.

4

The CPI data (Fig 5) has been steady at about 1.6% with ECB expecting it to reach the 2% target in 2018 given the improving PMI, steadily decreasing unemployment rate and strong employment numbers (Fig 6). Due to the strong macroeconomic fundamentals and communication from ECB policy statements, the expectations of tapering of the bond buying program have been growing strong over the last one year. Since both the US and Eurozone economies have been doing well, we need to compare how the expectations of rate hikes in the US have pared in comparison to ECBs taper tantrum in the investor community to understand the movement in EURUSD.

Let us now look at the factors which have driven investor confidence in the US and Eurozone economies in the last one year.

Factor 1: Percentage change in Yield Spreads

Figure 7 below shows percentage change in yield spreads between 10 year US Treasury bonds and 10 year German Bunds.  5

The percentage change in spreads has considerably widened in June & December 2017. This means that the rate of increase in German bunds is more than US treasury yields. Since the investors were earning higher returns on a relative basis in Germany, demand for Euro increased. Moreover, strong macroeconomic data in the Euro region and taper tantrums by ECB forced investors to unwind their carry trades thereby further strengthening Euro.

Factor 2: Historical Yield Range Bounds

6

Figure 8 above shows the historical yield range bound of US 10 year Treasury bonds & German 10-year bunds. Since the difference between upper bound & current yields is much higher in case of German bunds as compared to US Treasury yields, we believe that there is more upside potential for German Bunds. This might be another factor which resulted in an appreciation of Euro against US dollar.

Factor 3: Yield Curve

7

The yield curve of US treasuries (Fig 9) & German bunds (Fig 10) as on February 2017 & 2018 indicates that while 1 year US yields have risen more than 10-year yields but same is not true for German yields. The spread between US 10 year & 1-year yields have decreased from 164.7 to 90.1 basis points and that of German 10 year & 1-year yields have increased from 117.2 to 134.2 basis points. This yield curve flattening in the US shows the declining confidence of investors in the long-term growth prospects which again has contributed to the weakening of USD.

All the above factors indicate the various possible reasons as to why USD has depreciated with respect to Euro over the last one year. Though, the list of factors might not be exhaustive but these certainly form the contours of analyzing a currency pair. The analysis that we have carried out so far is historical in nature.

In the next part of this blog, we will talk about the forward-looking analysis of currency movement and its key determinants. Finally, based on this analysis we will look at a trade idea on EURUSD pair for a time horizon of 1 year.

Disclaimer – All the views expressed are opinions of Networth – IIMB Finance Club – members. Networth declines any responsibility for eventual losses you may incur implementing all or part of the ideas contained in this website.

Indian Economy – An Optimistic Anxiety

Blog by: Arush Dixit, Ayush Agrawal, Koustav Mandal, Rishi Vora & Shivam Singhal

Picture0

The current state of the Indian economy is what we call as that of an “Optimistic Anxiety”. Not to be buoyed down by the current quarterly slump in the growth rate, the global bankers are still counting on India to bounce back and be the fastest growing economy in the world. This oxymoronic outlook arises from a medium-term euphoria countered by near term deflationary measures. The historic implementation of Goods & Services Tax (GST) with its potential of ‘One Country, One Market’, RBI’s & Government’s measures to mitigate the Twin Balance Sheet (TBS) challenge and the general confidence in the financial market about growing macro-economic stability has created a buoyant outlook for the economy in the medium term. However, this enthusiasm is curtailed by the more immediate problems of stalled Industrial production, increased demand for farm loan waivers and rising NPA’s in Public Sector Banks.

Goods & Services Tax (GST) will bring harmonization of tax laws and procedures across country creating a unified National market leading to ease of doing business. The GST regime should result in production efficiencies that could raise global competitiveness, improve profitability and increase GDP. Doing business in the country will be tax neutral irrespective of the place of doing business.  GST would mitigate huge compliance cost incurred by the companies on complying with various indirect tax laws, administrative cost incurred by the Government, capture value addition and widen the tax base; it would generate a third-party paper trail and prevent tax evasion or black money circulation; and it would boost exports by making them zero rated. (To get a detailed understanding of GST, refer previous blog post here)

The government has also taken some key initiatives to Non-Performing Assets (NPA) of Public Sector Banks. New ordinances have been passed for amendment in banking laws to strengthen the Central Bank. The amendments give RBI the right to issue directions to any banking company to initiate insolvency resolution process in respect of a default under the provisions of the Insolvency and Bankruptcy Code. Recognizing that key to reducing NPA’s timely recognition of bad assets, new ordinances will enable RBI to take a call assigning final haircuts, where Rating Agencies or other independent evaluation could be mandated for banks to value specific NPAs and assign haircuts.

These initiatives by the government and RBI have led to positive outlook of the economy by the industry leaders and bankers. However, we should take this buoyant story of the Indian economy with a pinch of salt. The media and politicians are painting a rosy picture of India as the land of opportunities but it should not be believed blindly. Instead all these claims need to be backed by strong data. If we look at the Index of Industrial Production (IIP) which details the growth of various sectors like manufacturing, mining and electricity, the growth rate has seen a steady decline over the years with sharp drop in 2017 from ~5% to less than 2%.

Picture1

Figure 1: India Industrial Production Trend (Source: CSO)

Capacity utilization rate, which indicates the buoyancy in production as well as potential future investments has also stalled at 72%, 8% below the high in 2010 at 80%. A low capacity utilization indicates that the existing industrial capacity is sufficient to meet the current demands of the consumers. Hence it reduces the scope for future investments in the industry.

Picture2.png

Figure 2: Capacity Utilization Trend (Source: CSO)

However, during this same time period the 10-year government bond yield is at close to the lowest value in past 15 years at 6.4%. As bond price and bond yield follow an inverse relation, this decline in yields imply higher bond valuation. Even more striking is the rally of Sensex in 2017 with an intra year gain of close to 11%. Even more striking is the high P/E ratio of the Indian stock market with NIFTY 50 going on an average of 24 and BSE at 23. These levels are the same as achieved in 2007 and are significantly more than the long-term average of 18. Such high P/E values can only be sustained if the investors feel that there is scope of future economic growth. If not then there is a strong tendency for reversion towards more realistic valuations as happened in the aftermath of 2008 recession.

Picture3.png

Figure 3: Sensex & Price Earnings Ratio (Source: CSO)

Farm loan waivers have been announced by several state governments in line with their pre-poll promises and more will follow in the run up to 2019 elections. The farm revenues declined due to a decrease in price of non-cereal crops which were then further aggravated by consecutive droughts of 2014-16, resulting in a growing demand of farm loan waivers from major producer statesThese waivers will further deteriorate the state finances which have already taken a hit after the power sector reform scheme UDAY. The increase in debts and liabilities of states will prompt the states to check their expenditures or increase their revenues by raising taxes to control fiscal deficit. The decrease in capital expenditures will have an adverse impact on economic growth.

The Economic survey 2016-17 by Ministry of Finance in its assessment states that farm loan waivers may increase public spending in the short run on the back of rise in wealth of farm households, but also warns that the negative effects of states cutting on expenditures may overpower the positive effects of increased farm households spending, thereby leading to reduced aggregate demand.

The question now arises is whether the promised growth outlook can be maintained. The Indian GDP grew by on average of 7.5% over the past 2 years against weak investments, production, export volume and credit. This poses a puzzle on the real reason of this stupendous growth. To tackle this puzzle, the Indian Economic Survey did a cross-country comparison of GDP growth and the aforementioned growth factors. They observed that in the past 25 years, there has never been a scenario of country growing by over 5% with the economic factors as that of India. This is in sharp contrast with the Indian GDP growth of over 7%. Hence it can be concluded that it’s not the exports and production but consumption that is driving the current growth phase. However, to sustain this current growth trajectory, action must be taken on the regular growth drivers of investments, exports and credit or else the GDP growth rate slump of 5.7% in Q1 will move from becoming a shock to the new norm.

We believe that to turnaround the economy, government needs to increase the amount of credit available to the industries. Currently the Public Sector Banks have shown slowdown in credit growth rate owing to higher NPA’s which has reduced the capability of Medium & Small Enterprises to make investments. Recapitalisation of Public Sector Banks by the government will enable them to drive the credit growth and ease the pressure from private sector which will help in driving the growth of economy. The government should divest some of its stake in these PSBs to raise this capital so as to not put additional pressure on its fiscal balance sheet.

Growth can also be fuelled by creation of new jobs and India, with the largest youth population in the world, has an immense scope in it. While growth revival through public spending will itself create jobs especially in the construction sector, it is also of great importance to focus on other labour-intensive sectors. The archaic labour laws should be revamped making it easy for the firms to hire and fire employees. This will enable an increase in fixed term employment compared to the current situation where workers work on a temporary contract basis.

Disclaimer – All the views expressed are opinions of Networth – IIMB Finance Club – members. Networth declines any responsibility for eventual losses you may incur implementing all or part of the ideas contained in this website.

Source: http://indiabudget.nic.in/e_survey2.asp

RBI Rate Cut Conundrum (Part 2)

Blog by : Arush Dixit, Ayush Agrawal, Koustav Mandal, Rishi Vora & Shivam Singhal

1

Yesterday, we discussed about the various factors which could prompt RBI to cut rates tomorrow. Today, we examine potential reasons for no rate cut followed by our take on the policy decision and a trade idea based on our view. 

Why Status Quo?

We attribute the following as potential reasons for status quo by RBI:

  1. GST and 7th Pay Commission implementation: GST and HRA increase under 7th pay commission kick started on 1st As a result, their upside impact on CPI inflation is yet to be seen. Under this uncertainty, RBI might want to go for wait and watch approach until more data points are available. It is expected that the CPI inflation might increase by ~65 bps solely due to HRA increase as per a HSBC report. Also, CGST, IGST and SGST components in industries like entertainment, services, household products etc. which form a part of CPI basket have increased which might put an upward pressure on CPI inflation.
  2. Rise in commodity prices: Thomson Reuters CRB commodity index (an index to track commodity prices) comprising of crude oil, steel, aluminium, copper, coffee, cocoa, wheat, soya bean and other commodities shows that the commodity prices have rebounded. This increases the possibility of costlier raw material imports in near future thereby posing an upside risk to CPI inflation. The following figure illustrates CRB index time series data:CRB
  3. Twin deficit problem: The RBI deputy governor Dr. Viral Acharya, in his recent comments mentioned NPA resolution as the top priority for the apex bank. The gross NPA of Indian banks rose to 9.6% in March 2017 from 9.2% in September 2016 as per RBI data. This reduces the probability of rate cut as RBI would want to focus first on structural issues to improve the policy rate transmission mechanism. At the same time, the balance sheets of corporates are over leveraged which is deterring them from borrowing. Due to this twin deficit problem, we might see a cautious approach from RBI.
  4. Rising state fiscal deficit: Over the past 5 years, state fiscal deficit has been on the rise and recently, it has converged with the centre’s fiscal deficit. Moreover, recently the government has provided farm loan waivers which will put additional pressure on the state fiscal balances. The total amount of farm loan waivers is ~Rs. 3.1 lakh crore which accounts for 2.6% of the country’s GDP. Not only will a higher fiscal deficit and hence a higher borrowing crowd out private investment, but it would also compel RBI to keep the policy rates unchanged so as to keep a check on state’s fiscal prudence by keeping higher debt servicing cost.Untitled

Conclusion

As we have seen from the above analysis, there are multiple factors at play which might sway RBI’s decision in either direction on 2nd August. Whatever happens, India Inc. and FIIs are expected to stay optimistic about India’s growth story owing to continuing structural reforms undertaken by both – a politically stable government and an independent RBI.

Apart from policy rate decision, a major focus of the Indian markets would be on the language/forward guidance as provided by the MPC. The MPC would also take into account the associated risks arising from balance sheet unwinding by the US Fed and tapering of quantitative easing by the European Central Bank. This would in turn set the tone for the future bi monthly monetary policy reviews.

Our Take

Repo Rate stance: After analysing all the factors as discussed above, we believe that RBI would go for a 25 bps rate cut to 6% on 2nd August. We also expect RBI’s stance to be neutral owing to structural problems in the economy which is hampering private sector lending. We believe that this might be the last opportunity in this fiscal year for RBI to cut policy rates and provide enough time for transmission to the banks as inflation at the moment is bottomed out.

Reverse Repo stance: The reverse repo rate at this point is 6% leaving no margin for RBI to cut policy rates by 25 bps. Therefore we believe, that the rate cut would be complemented by a 25 bps reduction in reverse repo to 5.75%.

CRR stance: No change in CRR as increase in CRR at this point might put pressure on already stressed banks. This should be the last resort to suck liquidity given the circumstances.

SLR stance: RBI is likely to keep the SLR unchanged as the banks are already holding significant amount of government securities (~29%) on their balance sheet.

Open Market Operations (OMOs): Since there is excess liquidity in the system as witnessed during the 6th July OMO operations conducted by the RBI which was 6 times oversubscribed, RBI would need to engage in multiple OMO operations in future to suck excess liquidity out of the banking system.

Trade idea

Capture

Back in the first week of February, we observed similar dynamics where a rate cut from RBI was priced in. Post February there has been no rate cuts and currently the benchmark 10 year yields is trading at a similar level implying the pricing in of a 25 bps rate cut. We feel that there is limited downside to the yields as we expect only one rate cut in this fiscal year. So, we recommend going short 10 year government securities i.e. yields to rise.

Entry level: 6.4%
Target Yield: 7% (high made since January’17)
Stop Loss Yield: 6.25% (based on 4:1 reward-risk ratio)
Horizon: 1 year

Disclaimer – All the views expressed are opinions of Networth – IIMB Finance Club – members. Networth declines any responsibility for eventual losses you may incur implementing all or part of the ideas contained in this website.

RBI Rate Cut Conundrum (Part 1)

Blog by : Ayush Agrawal, Koustav Mandal, Rishi Vora & Shivam Singhal

1

RBI is going to convene for its bi-monthly monetary policy review on 2nd August 2017. The MPC would most certainly be divided in its opinion about the policy rate cut given plethora of macroeconomic factors that are currently playing in the domestic and global markets. This has kept the businesses and traders guessing about RBI’s stance and more importantly its forward guidance about the Indian economy. In this blog, we will analyse the various factors that might have significant role in determining RBI’s decision and come up with our recommendation and trade idea for the D-day.

Historically, RBI has been accommodative in its policy rate decision since January 2015. The repo rates have been cut by 175 bps majorly due to stabilization of CPI at ~6% from a high of ~12% in 2013 and softening in the commodity prices due to global slowdown thereby prompting RBI to create a favorable ecosystem for pickup in investments. The following chart explains the shift in macroeconomic fundamentals of India since 2012:

Chart 1

As we can see from the above chart, both the 10 year government yields and CPI have shown a downward trend in the last four years indicating the accommodative stance of RBI.

Why Rate Cut?

We attribute the following as potential reasons for rate cut by RBI:

  1. Lower inflation (CPI) and surplus liquidity: The target band of CPI inflation is currently set at 2-6%. The latest CPI inflation number of 1.54% has deviated from the lower bound of the target thereby indicating a need for easing the monetary policy. The inflation numbers have steadily followed a downtrend with the last three data points below 3% mark. Also, there is surplus liquidity in the banking system and dismal credit growth, thereby increasing the need to spur investment. This can be made more probable by providing banks with higher margins (between lending and borrowing rate) through rate cut. Given the inflation numbers at this point are below 2%, RBI runs very low risk of overshooting the target band by cutting policy rates on 2nd August.
  2. Lower GDP growth and index of industrial production (IIP): There has been a decline in GDP growth rate to 6.1% against the market expectations of 7% YoY. The major reasons attributed to this slowdown are demonetization and decline in output in almost all sectors except agriculture which has led to one year low in IIP number of 1.7% against an expectation of 2.8%. A rate cut at this point would shift the IS curve (due to increase in investment) to the right thereby increase aggregate demand and hence the output in economy.Chart 2
  3. Good monsoon expectations: According to the latest India Meteorological Department (IMD), the cumulative rainfall received till now is 103% of the benchmark long period average. This is attributed to the absence of El Nino. In India, the monsoon is critical to India’s farmers as it accounts for more than 70% of the total annual rainfall and recharges water levels in reservoirs in the absence of proper irrigation facilities in most regions. This would lead to increase in supply demand differential for food items which would keep the prices muted in near future. Since food component has a weight of ~46% in CPI basket, it is likely to put downward pressure on CPI inflation.
  4. Exchange rate and interest rate differential: USD/INR has depreciated (INR has appreciated) from ~67 to ~64.5 post UP election results due to greater confidence in the current political regime. This has resulted in higher capital inflows in the Indian economy. As a result, FII investments have increased to all time high of ~$26bn thereby further warranting the need for rate cut to drive up the investment sentiment and continue to boost foreign investments in India. Stronger INR would also make imports cheaper thereby reducing imported inflation.3
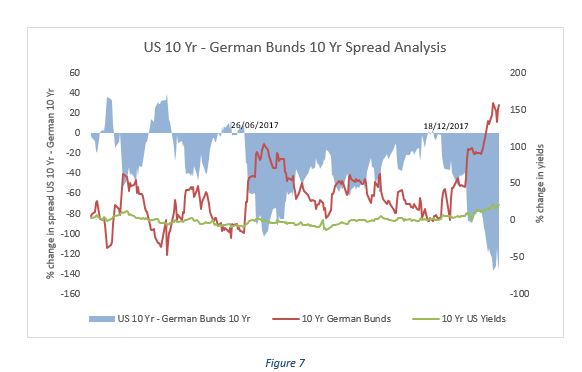
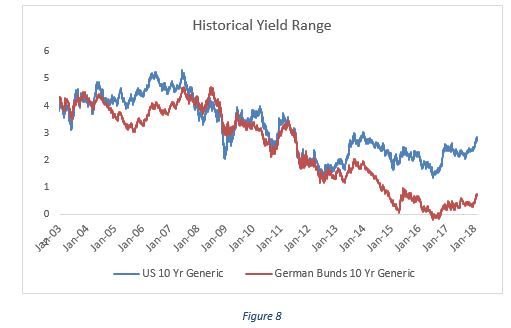
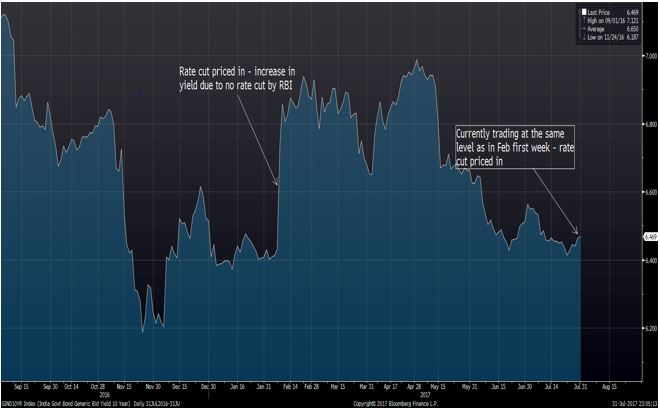
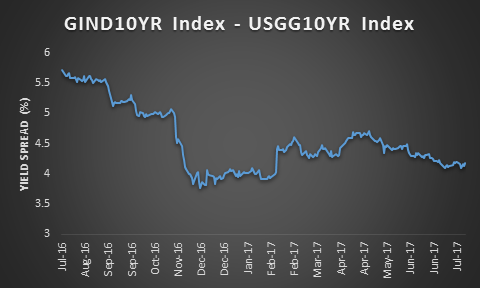
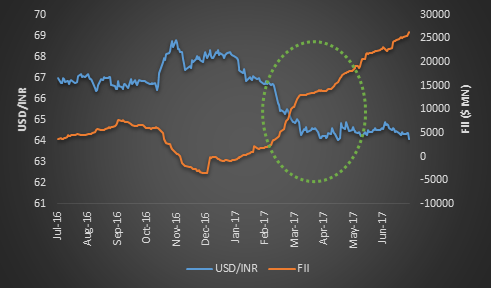
Despite the rate hike cycle in US resulting in a decrease in the interest rate differential in 10 year government yields between India and US, there has been minimal impact on the capital inflows in India. This shows that a rate cut by 25 bps at this point of time will not hurt the capital inflows given the optimism in investor sentiment owing to India’s growth story.4
  5. Dovish Fed: As per the last FOMC statement, the Fed chair Janet Yellen was apprehensive about the inflation target. Therefore, we expect a dilution in the hawkish stance and Fed is likely to follow a wait and watch approach before taking any policy decision. Also, IMF has downgraded US GDP growth forecast from 2.3% to 2.1% in 2017 and from 2.5% to 2.1% in 2018 due to lack of action on promised policy changes by Trump administration. This further would reduce the chances of steeper rate hike cycle in the next financial year.
  6. Weak Capacity Utilization: Based on Order Books, Inventories and Capacity Utilization Survey (OBICUS), the capacity utilization has declined successively for three quarters during 2016-17 and stood at 72.7% in Q3 2016-17. Also, the below table shows that average finished goods inventories have been increasing and the Inventory/Sales ratio has also shown an uptrend indicating weaker demand in the market. Therefore, in order to spur demand and improve capacity utilization, we believe RBI should go for a rate cut.Capture

In the subsequent part of our blog which would be published tomorrow, we would talk about why RBI could go for status quo on repo rates followed by our take on the policy stance that RBI should take. We would also recommend a trade idea based on our analysis. Do watch out for the next post from Networth!!

Disclaimer – All the views expressed are opinions of Networth – IIMB Finance Club – members. Networth declines any responsibility for eventual losses you may incur implementing all or part of the ideas contained in this website.

Inflation: The most iniquitous tax (Part 2: Recommendations)

In our previous blog on inflation, we looked at how high inflation can be unjust for different sections of the society (more so for the lower income bracket population).

image1

Blog by: Archana Maganti, Ayush Agrawal & Rishi Vora

In order to reduce the inequity levied by high inflation, we recommend that both the government and RBI can take the following fiscal and monetary reforms:

  • The strategy of RBI is to stabilize inflation at 4% with tolerance limit of 2%. The usual way for RBI to achieve it is by increasing policy rates (Repo, Reverse repo, CRR, SLR) which will translate to increased lending rates of the banks and credit issue. The defects in this mechanism are two-fold – (1) lack of financial inclusion which dampens the effectiveness of these instruments (2) these instruments do not make any distinction between credit intended for short term consumption and credit intended for long term productive assets. Moreover, the lending becomes dearer, primarily affecting agriculture and manufacturing sectors. The exchange rate appreciates (in short term) due to carry trade facilitating the entry of foreign portfolio funds, which reap more benefits than the local producers. Hence, we recommend that a separate credit mechanism be made available to these priority sectors whose borrowing rates should be competitive when compared to other countries. We also recommend to continue with the current financial inclusion schemes.
  • RBI should use the differential between wage growth and inflation index for each income group (as discussed in ‘Inequity in impact of CPI fluctuations’ section in the previous blog) as a proxy for impact of inflation rather than using inflation index as a standalone measure. The policies (both fiscal and monetary) should be focused around the group that has the lowest value of differential. This will ensure that RBI is focusing on the income group that is most adversely impacted by current inflation.
  • The government’s budget is composed of revenue component and capital component. The government collects money mainly through taxes. However, on the expenditure front, revenue expenditure does not lead to any increase in aggregate supply i.e creation of assets/increase in aggregate income in the economy while capital expenditure increases the number of assets and hence leads to increase in aggregate supply in the economy. Therefore, if the government borrowing is used to finance capital expenditure then an increase in aggregate demand would be complemented by an increase in aggregate supply which would lead to lower inflation as compared to revenue expenditure where aggregate supply remains constant. We recommend that the government should look to reduce revenue deficit to zero while financing only capital budget deficit through the money borrowed from RBI/foreign inflows.
  • In order to control revenue expenditure through monetary policy, RBI should reduce SLR. On the recommendation of 1991 Narasimham Committee, SLR was reduced from 38.5% to 25%. Since then, our economy has grown by more than six times but SLR has only been reduced to 21.5% which provides government with a higher quantum of money for revenue expenditure. We recommend that a reduction in SLR to around 15% would make a portion of that quantum available to be lent for investment which will result in better asset generation thereby controlling inflation.
  • Steps to control food inflation (which constitutes 57% of the CPI) should be taken. Around 40% of the food by value is being wasted in India annually.[1] The main reasons for these include inadequate supply chain management, few cold storage facilities (10% of the total requirement), inefficient transportation management and negligible incentives to invest in agricultural sector for domestic as well as foreign investors. The government needs to focus on improving agriculture infrastructure by building cold storage facilities across India and by making transportation system faster. The government also needs to focus on improving food processing technology by incentivizing investors to invest in this technology and educate farmer about using this technology.
  • To decrease the effects of inflation on vulnerable classes of people, tax brackets should be indexed to inflation so that people can only be charged what they afford to pay in real terms. Although the current tax laws provide for indexing, they still lack the full indexing which will mitigate iniquitous effects of inflation. An additional cess or an additional tax bracket on the top 10 percentile of the country may be considered to even out the indexing effects. Widening the tax base through effective tax reforms and digitization of transactions can also help decrease revenue deficit and thus reduce inflation.

Based on our analysis, we conclude that neither high nor low inflation should be prevalent in the economy. RBI and government should work together to control inflation levels at around 4% which would ensure a balance between growth and price rise. The purpose is to operate the economy at its full potential without overheating it. A prerequisite for implementing the above solutions is to first understand the employment potential of the economy and gradually pushing the frontiers through planned investment.

Disclaimer – All the views expressed are opinions of Networth – IIMB Finance Club – members. Networth declines any responsibility for eventual losses you may incur implementing all or part of the ideas contained in this website.

[1] http://thecsrjournal.in/food-wastage-in-india-a-serious-concern/

Inflation –The most iniquitous tax

“One reason inflation is so destructive is because some people benefit greatly while other people suffer; society is divided into winners and losers. The winners regard the good things that happen to them as the natural result of their own foresight, prudence, and initiative. They regard the bad things, the rise in the prices of the things they buy, as produced by forces outside their control” – Milton Friedman 

Blog by: Archana Maganti, Ayush Agrawal & Rishi Vora

inflation1

Introduction

Inflation can be defined as too much money chasing too few goods. One of the primary reasons of inflation in developed economies is high government deficit (revenue – expenditure). If the government has a deficit, then this deficit is financed by external or internal borrowings. This leads to a rise in the incomes of the people and hence an increase in the aggregate demand which is given by the formula:

∆Aggregate Demand = 1/(1-mpc)*∆Income

MPC (Marginal Propensity to Consume): The marginal propensity to consume (MPC) is equal to ΔC / ΔY, where ΔC is change in consumption, and ΔY is change in income. If consumption increases by eighty cents for each additional dollar of income, then MPC is equal to 0.8 / 1 = 0.8.

Suppose a large corporation decides to build a factory in a small town and that spending on the factory for the first year is $5 million. That $5 million will go to electricians, engineers and other various people building the factory. If MPC is equal to 0.8, those people will spend $4 million on various goods and services. The various business and individual receiving that $4 million will in turn spend $3.2 million and so on. Hence this will form an infinite GP with r<1.

If the marginal propensity to consume is equal to 0.8 (4 / 5), then the multiplier can be calculated as:

Multiplier = 1 / (1 – MPC) = 1 / (1 – 0.8) = 1 / 0.2 = 5

We can see that, a change in income can lead to a much high change in aggregate demand (due to multiplier effect). Hence though inflation leads to no increase in the intrinsic value of goods or services, the demand for those goods and services increases thus leading to an increase in nominal prices. Depending on how the newly printed currency has been circulated, some would be able to afford the goods and services at the cost of others. In this blog, we will delve into the ‘bad’ of high inflation – how it promotes inequity in India – and later conclude by providing a strategy to counter these ill effects (in the follow-up blog).

Inflation – An added tax

Inflation is regarded as a case of taxation without representation or legislation. From the government’s point of view, inflation is essentially a monetary seigniorage (difference between the value of money and the cost to produce it) which acts as a source of revenue for the government. As the total value of assets remains constant, the government (currency issuer) is earning revenue at the cost of people (currency holders). Generation of new currency thus decreases the value of the existing currency (purchasing power), redistributes the resources in favor of government and acts as a hidden tax on the existing currency holders. This ‘inflation tax’ is then used by government to finance its debt, lower public expenditure in real terms and inflate GDP figures. (To know more about seigniorage in India, refer to the following link)

In a country like India, with dominant saving philosophy, millions of people particularly the poor who have no access to financial markets and pensioners who favor stability over risk, deposit money in savings accounts where nominal interest rate is generally lesser than inflation. Thus they end up paying this added tax to government every year.

Inflation – Effect on other taxes

Adam Smith laid down equity as the guiding principle of fair taxation: people should pay taxes per their ability to pay and marginal utility. However, inflation tax overrides this canon of taxation. Apart from acting as a tax itself, inflation also has a considerable impact on direct taxes i.e. ‘bracket creep’. For example, a year back a person who used to purchase a basket of goods at 2 Lakhs may not have been qualified as a tax payer, but at the current inflation rates, a person purchasing the same basket of goods at 2.5 Lakhs is now falling in the tax bracket, and has to lose his purchasing power in the form of taxes.

Iniquitous ‘Inflation Tax’

NSHIE Survey

The various components of CPI and their corresponding weights as used in India are as follows:

7

From the above table, we can see that food prices form the biggest chunk in determining the value of consumer price index.

Inequity in impact of CPI fluctuations

To compare the impact of inflation tax on different sections of the society, the percentage expenditure of these sections on different components of CPI have been compared using data from NSHIE survey. [1]

The following graphs illustrate the distribution of routine expenditure across various components for low, middle, and high income states [2] and for rural and urban population:

1

As shown above, low and middle income states have a much higher component of food in their total routine expenditure when compared with the high-income states. A similar trend can also be seen in the rural versus urban divide. Since food forms the biggest component driving CPI, it can be said that the impact of a higher ‘inflation tax’ is higher on low and middle income states as compared to high income states. Thus, we can safely conclude that inflation as a tax is iniquitous in the economy because not only does it act as an extra tax on the citizens but also because it is unequally distributed across various sections of the society.

However, we believe that CPI cannot be taken as a blanket measure of inflation for all income groups. Instead the government should look to develop different indices for different income groups where the weights would be decided based on sensitivity of that group to different components. This would help in capturing the impact of inflation on each income group better and thereby build policies around it. The overall inflation can be taken as the weighted average of the three indices where weights would correspond to percentage population in each group.

Inequity in generating returns from savings

Based on a NCAER household survey, it has been found that the percentage of investors is nearly 20% in urban areas while it is much lower (6%) in rural India.[4] At an overall level, less than 11% of the total households invest in the market. This shows that the number of savers form a huge proportion of the total households in India. The following tables list down the distribution of investors (in %) in rural and urban India as well as various modes using which the households save their income.

8

From the above tables, we can say that a higher inflation would erode the savings of both rural and urban population. This is because both urban and rural households save majorly through life insurances and savings accounts in commercial banks which provide low/no returns. It can also be seen that the lower and middle lower income groups save much more (in % terms) through life insurance which generate no returns. Thus, the impact of high inflation would be much higher on rural households as compared to urban households.

Though investments generate higher returns as compared to savings, some of the major reasons why Indians prefer saving instead of investing are:

  • Inadequate returns
  • Not sure about the safety of investments
  • Investments not very liquid
  • Inadequate information
  • No skills
  • Dissatisfied with the role of regulator
  • Inadequate financial resources

The following table lists down the weights (in %) of various reasons that non-investors attribute to their behavior

6

As can be seen, majority of the non-investors do not invest because of information asymmetry or because they have inadequate financial resources. This goes to show that lack of investments in India are due to factors which cannot be changed by spreading awareness about the benefits of investments or by making the investment systems more robust, safe or easy.

Conclusion

So far we have established that in Indian economy, the impact of high inflation (>5%) on different sections of the society is inequitable. Therefore, keeping inflation under control should be at the heart of fiscal and monetary policies of the economy. A failure to do so stands to bring the general public in cross-hairs with the government thereby disturbing the economic stability in the long run.

The government and RBI should curb the negative implications of high inflation by ensuring fiscal and monetary prudence. To know how we think this can be done, keep following “Macro in a nutshell” for the next blog on recommendations.

Disclaimer – All the views expressed are opinions of Networth – IIMB Finance Club – members. Networth declines any responsibility for eventual losses you may incur implementing all or part of the ideas contained in this website.

References

[1]http://www.thesuniljain.com/files/thirdparty/NCAER%20How%20India%20Earns%20Spends%20and%20Saves.pdf

[2] Low income states: Assam, Bihar, Madhya Pradesh, Meghalaya, Orissa, Rajasthan, Uttar Pradesh, Chattisgarh, Uttaranchal and Jharkhand; Middle income states: Andhra Pradesh, Himachal Pradesh, Karnataka, Kerala, Tamil  Nadu and West  Bengal; and High income states: Goa, Gujarat, Haryana, Maharashtra, Punjab, Pondicherry, Chandigarh and Delhi

[3]http://www.thesuniljain.com/files/thirdparty/NCAER%20How%20India%20Earns%20Spends%20and%20Saves.pdf

[4]http://www.sebi.gov.in/cms/sebi_data/attachdocs/1326345117894.pdf

[5]http://www.sebi.gov.in/cms/sebi_data/attachdocs/1326345117894.pdf